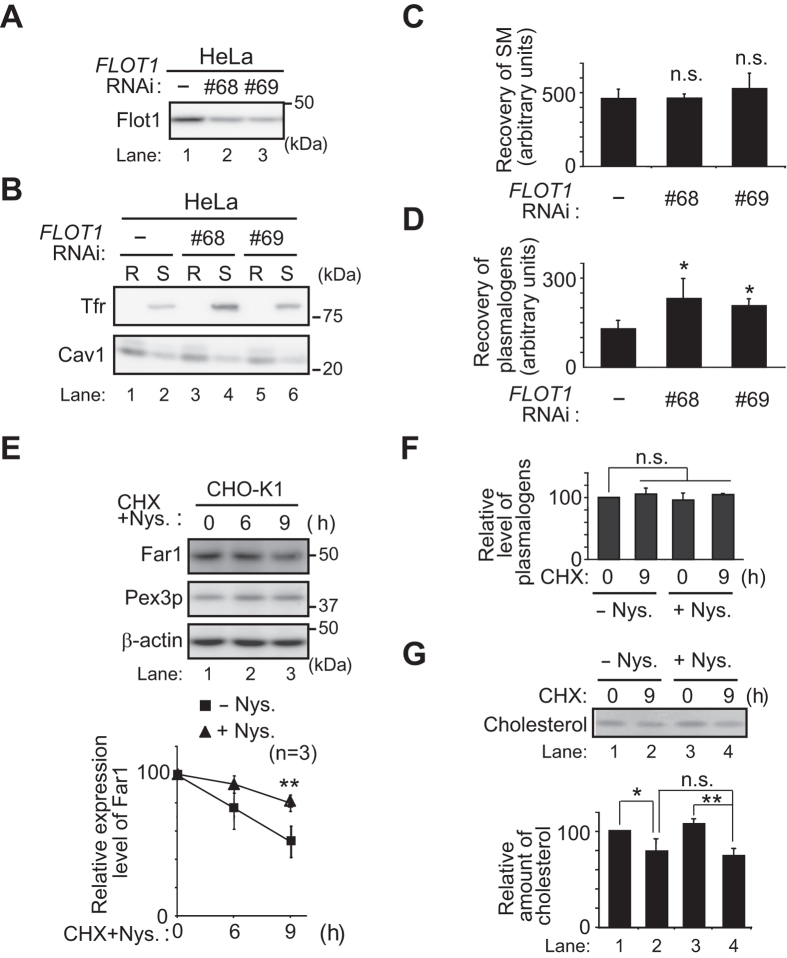
Figure 7. Knockdown of FLOT1 elevates the amount of plasmalogens and nystatin inhibits degradation of Far1.
(A) HeLa cells were transfected with two different dsRNAs (lanes 2 and 3) against FLOT1 and expression of Flot1 was assessed. (B) DRMs (R) and detergent-soluble (S) fractions were prepared as described in Materials and Methods and distribution of Cav1 and Tfr was assessed using respective antibodies. (C,D) Amount of SM (C) and plasmalogens (D) in DRMs prepared as in (B) was determined by LC-ESI-MS/MS and represented by arbitrary units. *p < 0.05; one-way ANOVA with Dunnett’s post hoc test versus mock-treated HeLa cells. n.s., not significant. (E) CHO-K1 cells were cultured for 1 h with nystatin (Nys.), a cholesterol-chelating agent, further incubated for the indicated time in the presence of CHX, and assessed for the expression of Far1 at each time point (upper panel). β–actin was used as a loading control. Relative amounts of Far1 in the presence (triangle) of nystatin at each time point were represented by taking as 100 that at the time point of CHX addition. The relative expression level of Far1 in the absence (square) of nystatin was from Fig. 1A (left panels). **p < 0.01; t test compared with the expression level of Far1 at 9 h in the absence of nystatin. (F) Cellular plasmalogens in CHO-K1 cells cultured in the absence (−Nys.) or presence (+Nys.) of nystatin were analysed by LC-ESI-MS/MS and their relative level was represented by taking as 100 that at (0 h, -Nys.). n.s., not significant by two-way ANOVA. (G) Lipids were extracted from cells cultured as in (F). Cholesterol was detected as described in Fig. 3E. Relative amount of cholesterol is represented by taking as 100 that at (0 h, -Nys.). *p < 0.05 and **p < 0.01; two-way ANOVA with Tukey post hoc test. n.s., not significant. Note that cellular cholesterol was reduced by the treatment of CHX but not with nystatin.

