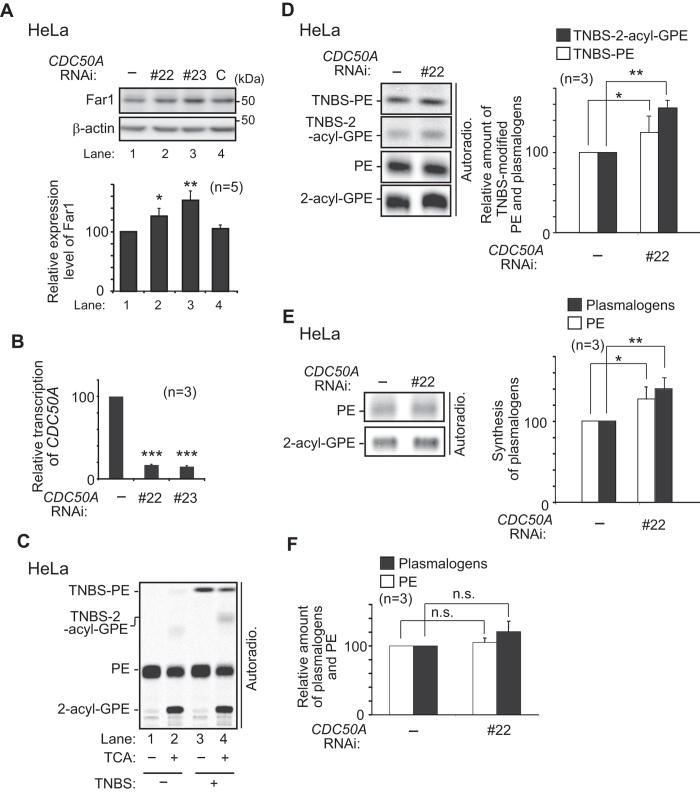
Figure 8. Elevation of plasmalogens localised at the outer leaflet of plasma membrane by CDC50A knockdown increases the expression of Far1.
(A) Expression level of Far1 was assessed in mock-treated HeLa cells (−) or cells transfected with control dsRNA (C) or two different dsRNAs (#22 and #23) against CDC50A (upper panel). β–actin was used as a loading control. Expression level of Far1 was represented by taking as 100 that in mock-treated cell (lower panel). *p < 0.05 and **p < 0.01; one-way ANOVA with Dunnett’s post hoc test versus mock-treated cells. (B) HeLa cells were cultured as described in (A). Expression level of CDC50A relative to RPL363 was determined by real-time PCR using total cell RNA. ***p < 0.001; one-way ANOVA with Dunnett’s post hoc test versus mock-transfected cells (−). (C) HeLa cells were cultured in the presence of 14C-Etn for 18 h and further incubated with (+) or without (−) TNBS. Total cellular lipids were extracted from aliquots of equal amounts of cell proteins before (−) or after (+) treatment with TCA and analysed by TLC. (D) PE and plasmalogens localised at the outer leaflet of plasma membrane were verified as in (C) in mock-transfected HeLa cells (−) or CDC50A-knocked down cells by transfection with dsRNA (#22) (left panel). Relative amounts of TNBS-modified PE (TNBS-PE, open bar) and plasmalogens (TNBS-2-acyl-GPE, solid bar) were represented by taking as 100 those in mock-transfected cells (right panel). *p < 0.05 and **p < 0.01; t test versus mock-transfected cells. (E) Plasmalogen synthesis was assessed in mock-transfected (−) or CDC50A-knocked down (#22) HeLa cells by metabolically labelling with 14C-Etn for 5 h (left panel). Biosynthesis of PE (open bar) and plasmalogens (solid bar) was represented by taking as 100 those in mock-transfected cells (right panel). *p < 0.05 and **p < 0.01; t test versus mock-transfected cells. (F) Relative level of PE (open bar) and plasmalogens (solid bar) in CDC50A-knocked down (#22) HeLa cells was represented by taking as 100 those in mock-transfected cells. n.s., not significant; t test versus mock-transfected cells. Data of unprocessed original blots are available in Supplementary Fig. S2.

