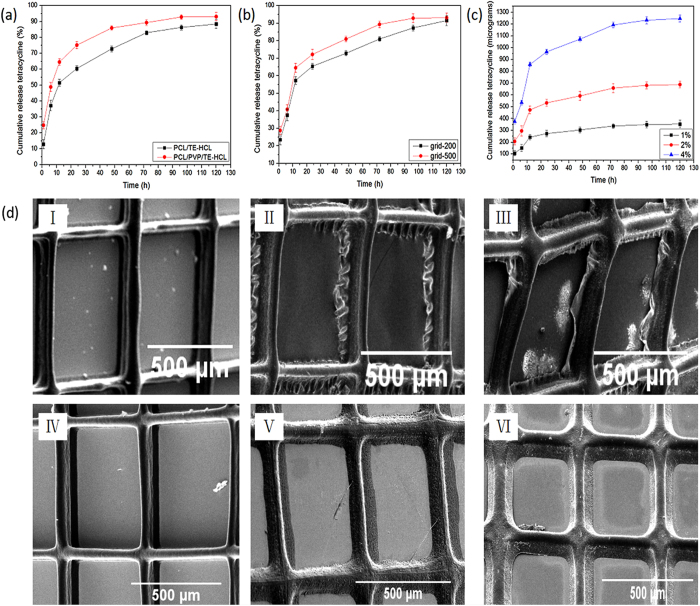
Figure 8.
Drug releasing profiles from; (a) pure PCL and PCL/PVP printed patches, (b) grids with varying pore sizes, (c) various TE-HCL loading within fiber matrix and (d) electron micrographs of drug loaded (TE-HCL) patches comprising PCL and PCL/PVP showing changes to fiber morphology at selected time intervals over the in vitro release study. (I) Drug-PCL printed patch at 30 minutes (II) Drug-PCL printed patch at 60 minutes (III) Drug-PCL printed patch at 90 minutes (IV) Drug-PCL/PVP printed patch at 30 minutes (V) Drug-PCL/PVP printed patch at 60 minutes (VI) Drug-PCL/PVP printed patch at 90 minutes.

