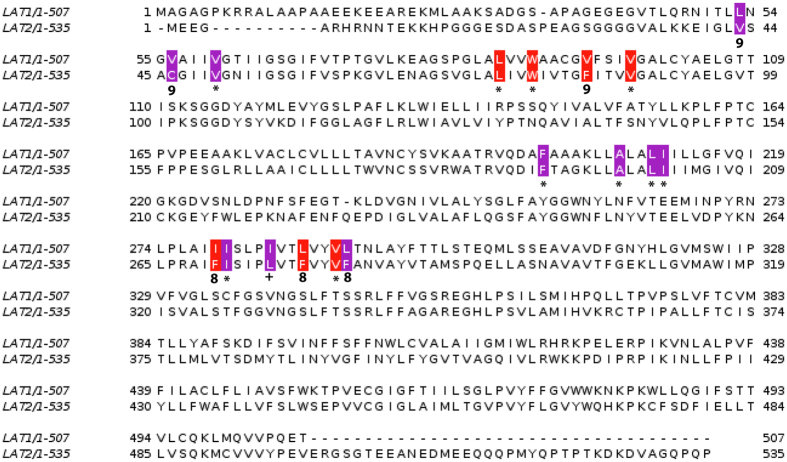
Figure 6. Comparison of the putative cholesterol binding site residues of LAT1 versus the LAT2 transporter sequence.
Sequence alignment of the putative cholesterol/CHS binding sites I (purple) and site II (red) from human LAT1 and LAT2. Identical residues are scored with an asterix (*), equivalent residues with a plus (+) and similar residues scored on a scale from 1–9, with 1 being variable and 9 being the maximal level of similarity.

