
Figure 2.
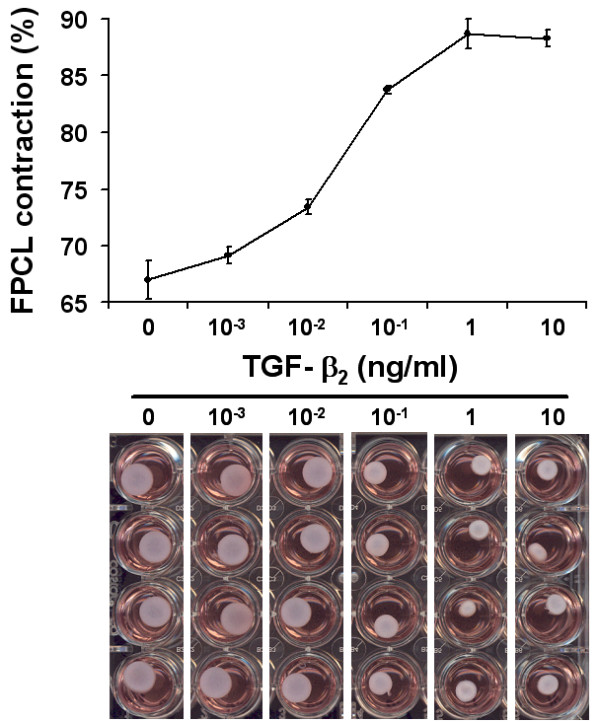
TGF-β2 dose response. The dose response curve (upper panel) shows the accumulated FPCL contraction (%) over 5 days. The degree of TGF-β2 stimulated contraction was measured over a large concentration range (>5 orders of magnitude). The plotted data shows a typical dose-response relationship, with maximal response elicited by 1 ng/ml of TGF-β2. Representative images of contracting FPCL after 5 days are shown for increasing concentrations of TGF-β2 (lower panel).