
Figure 3.
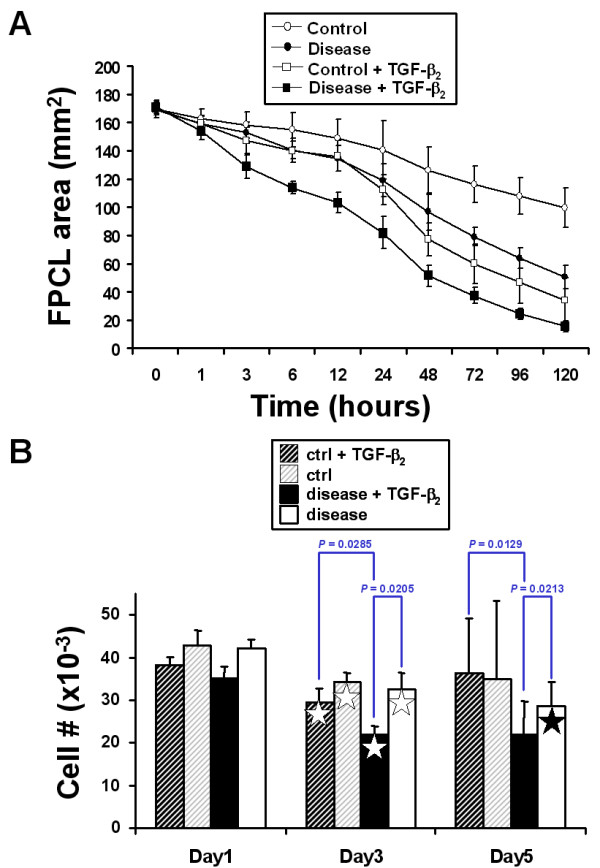
FPCL contraction in response to exogenous TGF-β2. Contracting FPCL cultures (± 1 ng/ml TGF-β2) were analyzed using Image J software to quantify collagen contraction. (A) The plotted data points represent the mean surface area ± SDM for three independent patient-matched primary FPCL cultures. Experiments were repeated in quadruplicate. (B) Cell proliferation/viability assays were performed on contracting FPCL cultures. The plotted bar graph represents the mean cell number ± SDM for the indicated time points for one representative patient-matched disease and control primary culture. Significant differences between groups are indicated by the P-values. The stars denote significance differences (P < 0.05) between the same treatment groups of different time points (white star – Day 1 vs. Day 3, black star – Day 1 vs. Day 5).