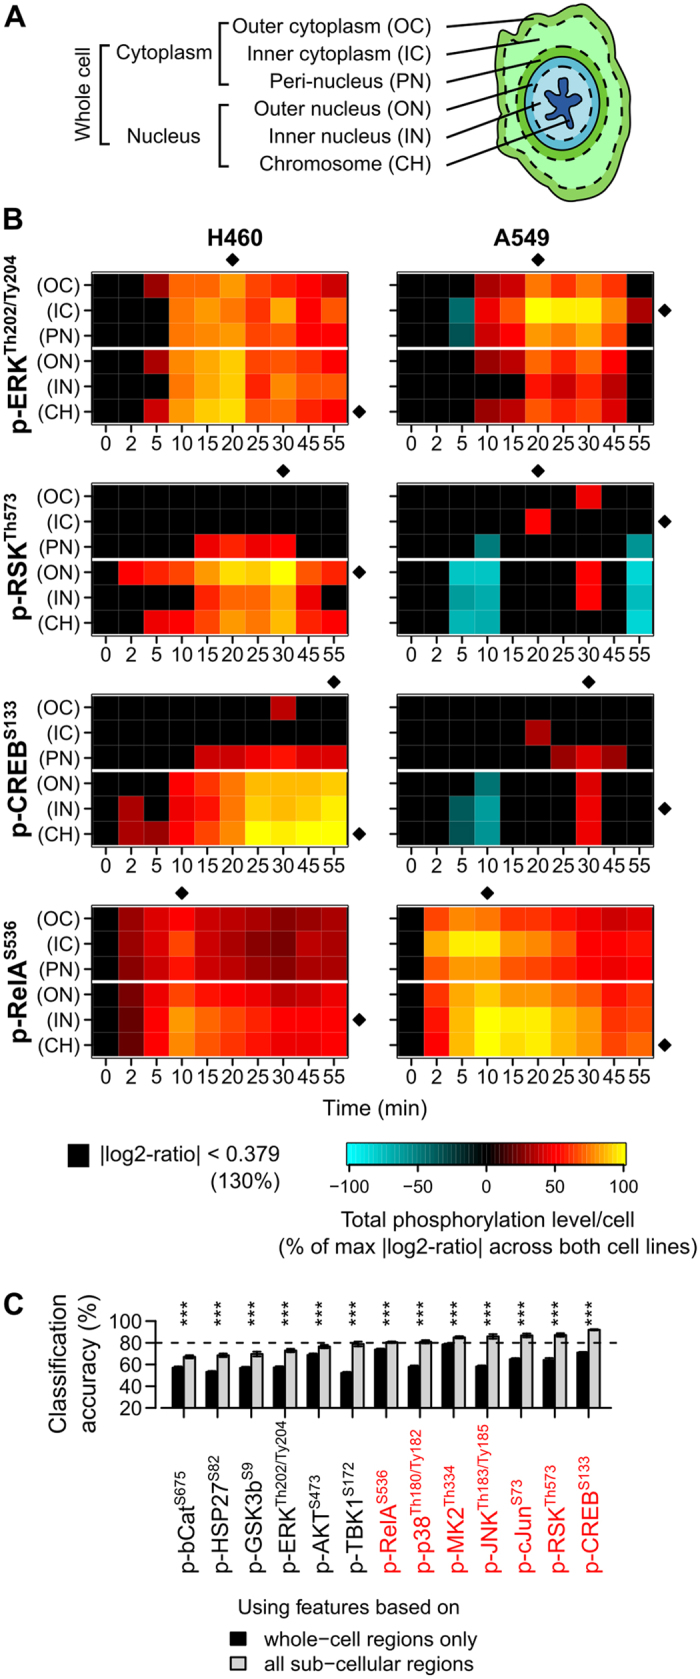
Figure 3. Most signals peak at different subcellular regions in sensitive and resistant cells.

(A) Schematic showing the nine automatically detected subcellular regions. The whole-cell, cytoplasmic, and nuclear regions are composed of other subcellular regions. Please also refer to Supplementary Fig. S6 for examples of actual microscopy images depicting these regions. (B) Heatmaps showing changes in four of the measured signals at different subcellular regions in H460 and A549 cells treated with 300 ng/mL of TNFα. All values are log2 ratios to the time-zero values (without TNFα treatment). All changes <30% are colored in black. For visualization only, the log2 ratios for each signal are divided by their maximum absolute value across both cell lines in all regions. (Diamonds = subcellular regions or time points with the maximum levels). (C) Mean balanced accuracies in classifying H460 and A549 cells using support vector machines based on the phosphorylation events of individual signals (dashed lines = selection threshold at 80%, red = signals selected for the second stage; ***P < 0.001, two-sided t-test; error bars = standard deviations). The values were estimated using three-fold cross validations with three random fold divisions.
