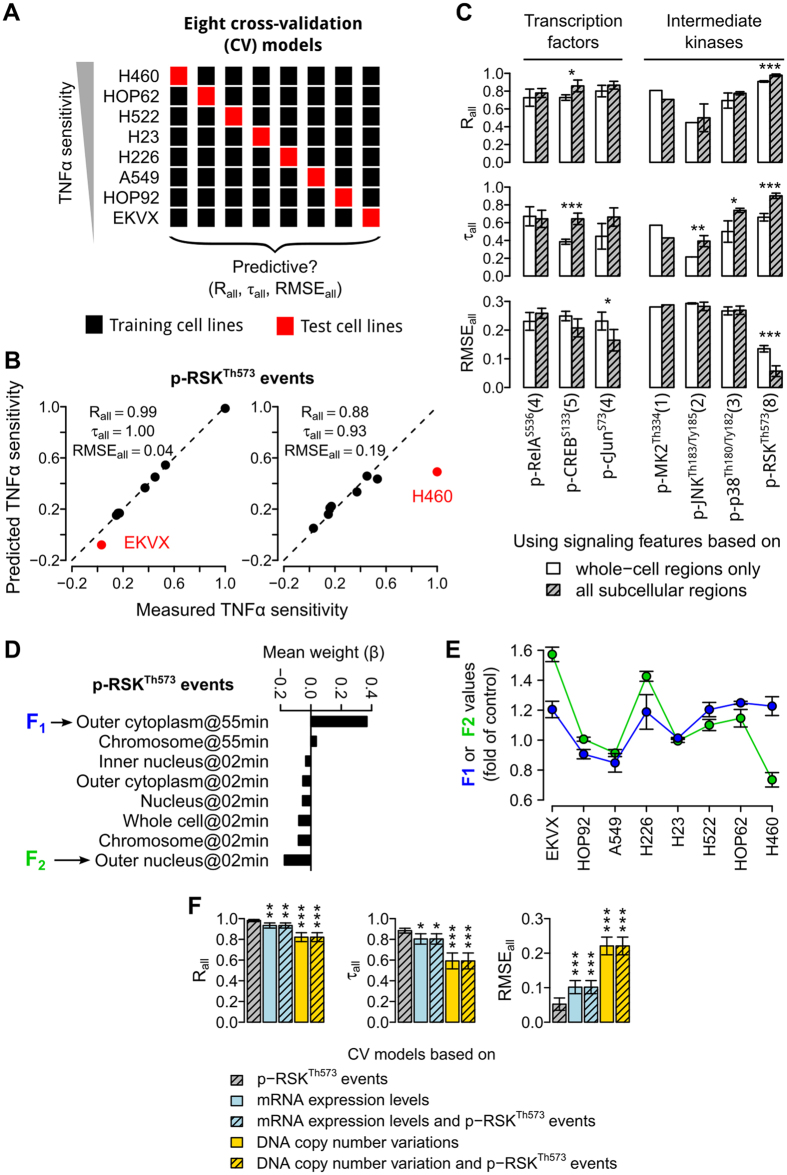
Figure 4. p-RSKTh573 is the most discriminative signal.
(A) Schematic showing the cross validation (CV) procedure used to train and test our linear regression models. For each signal, up to eight CV models were trained and tested. Pearson’s correlation coefficient (Rall), Kendalls’ correlation coefficient (τall), and root mean squared error (RMSEall) were used to evaluate the models. (B) Scatter plots showing the measured versus predicted sensitivity levels of NSCLC cells (dots) for two of the CV models based on the p-RSKTh573 (black = training, red = test cell lines). In these two CV models shown, the most sensitive (H460) or resistant (EKVX) cells were not used for model training, respectively. (C) Mean performance values of the CV models based on each or combinations of the seven selected signals. For each condition, the number of CV models that could be fitted is shown in the parentheses (*P < 0.05, **P < 0.01, ***P < 0.001, one-sided t-test.) (D) The average weights (βi) of p-RSKTh573 events across the eight CV models. Only weights with |βi| > 0.03 are shown. F1 and F2 = two p-RSKTh573 events with the highest |βi| values. (E) The average values of F1 (blue) and F2 (green) in all the eight cell lines (error bars = SEM). (F) Mean performance values of the CV models based on p-RSKTh573 events, genome-wide mRNA expression levels, DNA copy number variations, or combinations of these features of the cell lines (*P < 0.05, **P < 0.01, ***P < 0.001, one-sided t-test with respect to the CV model based on p-RSKTh573 events).

