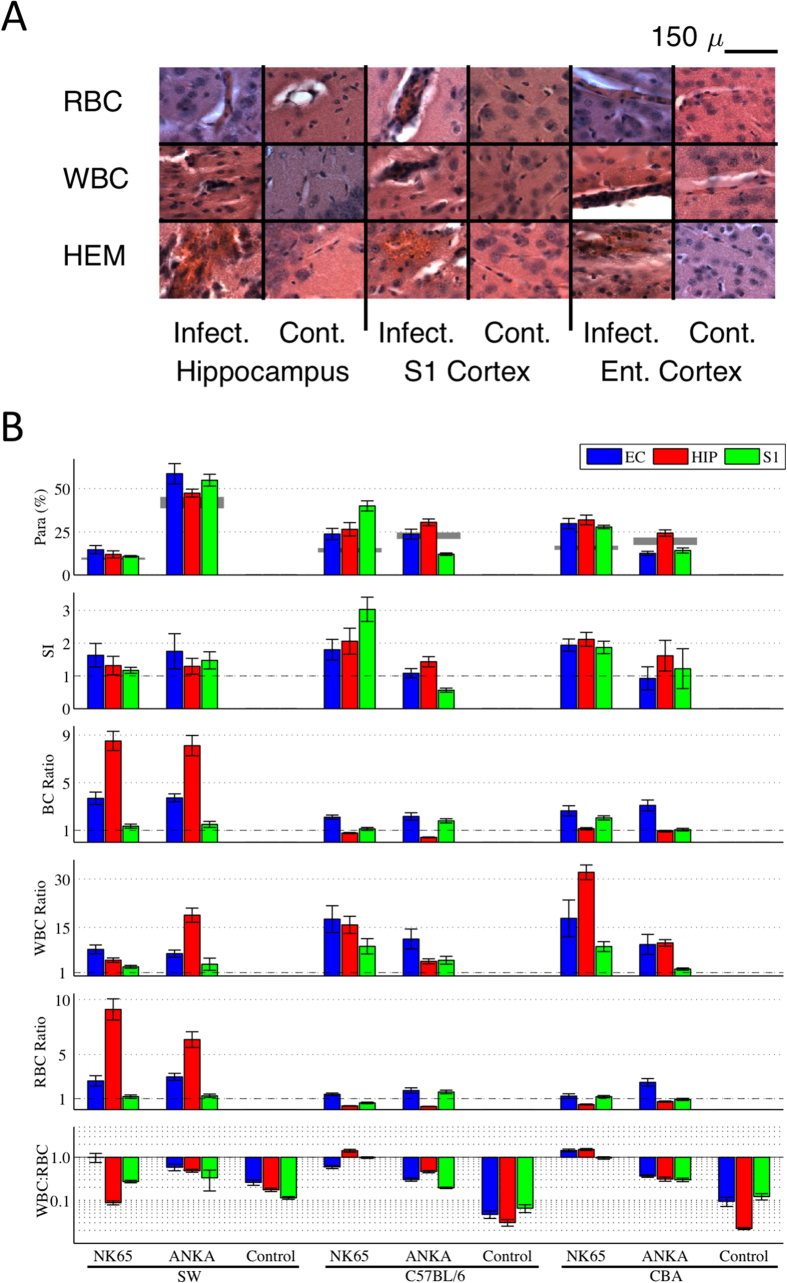
Figure 1. Histological characterization of acute cerebral malaria.
(A) Examples of the appearance of sequestration of red blood cells (RBC) and white blood cells (WBC), as well as hemorrhages (HEM) in hippocampus, primary somatosensory (S1) and entorhinal cortex (Ent.), in infected (Infect.) versus control uninfected animals (Cont.). In sequestration, the blood cells are accumulating within blood vessels, whereas in hemorrhage the blood cells are extravascular. No cerebral vessel congestion or hemorrhage was observed in control mice. Magnification 100X, scale bar 150 μm. (B) Quantitative brain histological characteristics from different mouse-strain and parasite combinations from animals sacrificed at peak CM infection. Each block represents mean and standard error of the mean of values averaged over cohorts of 10 animals. The top row is the fraction of RBCs infected with parasite within the brain (parasitemia, Para, in %), with the peripheral parasitemia level indicated with gray. The second row is the ratio of brain to peripheral parasitemia known in human CM pathology as the sequestration index (SI). SI ratios greater than 1 indicate trapping of iRBCs within the brain, a hallmark of human CM. Note that most strain combinations have evidence of sequestration, but that it varies by brain region. The blood cell densities in rows 3–5 are all normalized by region and strain-specific control values, so control values appear at 1. The third row details the total blood cell (BC) density, a composite of WBC and RBC densities in rows four and five, normalized by the individual mouse strain control values. In the WBC/RBC ratio (plotted on log scale in the sixth row) we find unusually elevated ratios consistently equal or greater than 1 for strain/parasite combinations C57BL/6-PbNK65 and CBA-PbNK65. Because such high densities have not been reported in human histology from CM, these two strain combinations were eliminated from further study. Note that all control WBC/RBC ratios were less than 1. For each mouse strain, shipments of 30 animals were distributed evenly and randomly among each of 3 inoculation groups (PbANKA, PbNK65, Control) so that controls included littermates of infected animals. Bars indicate ± 1 s.e.m.

