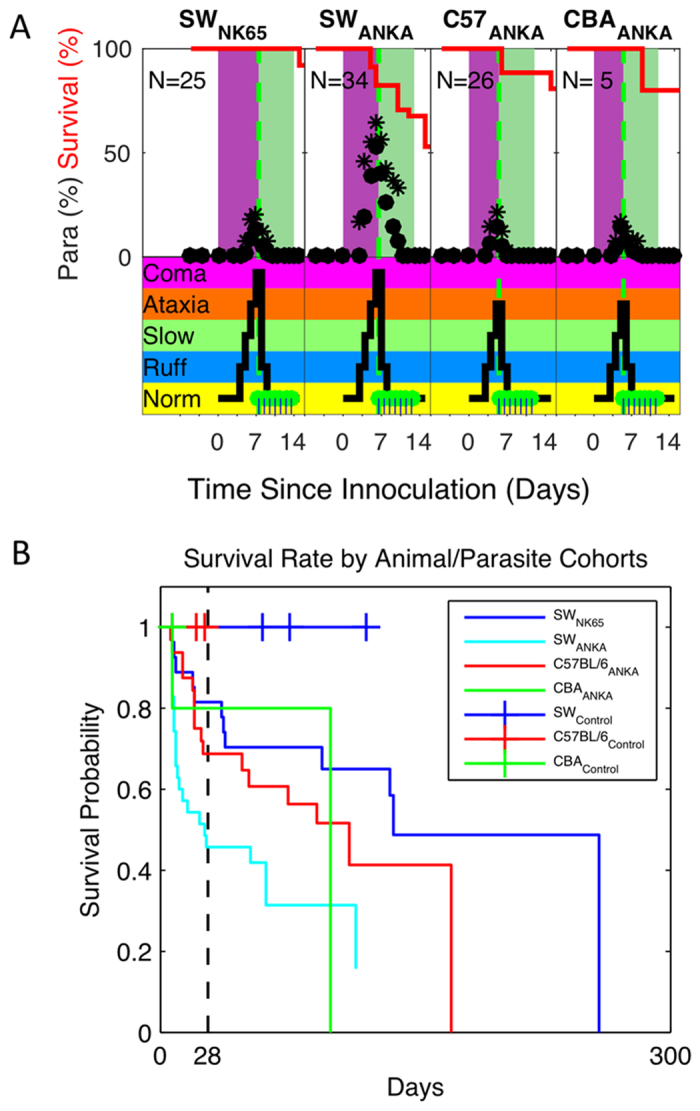
Figure 2. Parasitemia, Behavioral Signs and Survival curves from chronic monitoring cohorts.

(A) Shown in the upper panels are the peripheral parasitemia levels (average •, maxima *) for each mouse/strain combination, along with the survival probability (red line) through the infection (purple shading) and treatment (green shading) phases. Shown in the lower panel on the same time frame are the behavioral scale (BS) values, adapted from Caroll, et al.11. The green dots mark individual treatment times. BS values include: Norm – Normal behavior; Ruff - Poor grooming including observation of ruffled hair; Slow - Slow movement, including hunched body posture; Ataxia - Tendency to roll over on stimulation, ataxia, evidence of hemi- or para-plegia, ~10% body weight loss; Coma - Comatose, convulsions, >20% body weight loss. Note that within 1 day of treatment, infected animals’ parasitemia drops by approximately half and their behavior returns nearly to normal. (B) Shown are Kaplan-Meir curves for survival by mice with CM by animal-parasite strain combinations for all animals inoculated for chronic monitoring. Those sacrificed according to protocol, malarial recrudescence, or associated with surgery were censored. Note that the mouse strain SW demonstrated the shortest survival rates when infected with PbANKA (log-rank test p < 0.05), in contrast to the longest survival rates for SW infected with PbNK65.
