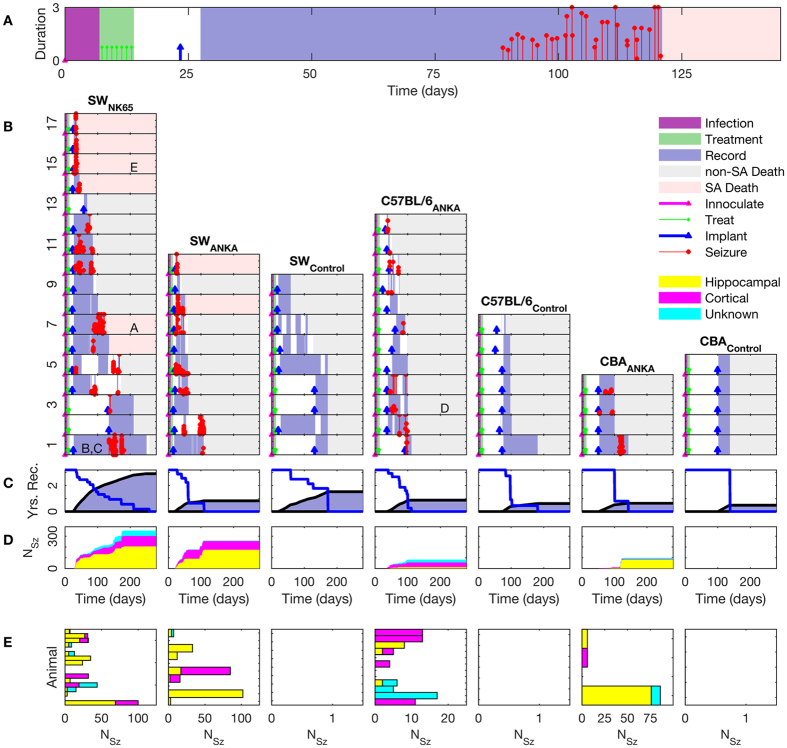
Figure 3. Summary time courses for each cohort and animal.
(A) Typical time course of an experiment from inoculation through to seizure associated (SA) death. (B) Time courses of all recorded animals, with columns for experimental strain combinations and control cohorts, and row for individual animals. The time courses begin with inoculation (magenta triangle) at day 0, and the period of infection is marked in purple. Treatment is indicated with green markers, the time of electrode implantation indicated with blue markers, and the periods of recording marked with blue background. The time of seizure occurrence over 10 s is indicated by red markers, with height representing duration in minutes. Time of death is indicated by the transition to grey (from investigator sacrifice, non-SA death) or pink (SA death) shading. Spontaneous deaths from the SA-death cohort forms the group further analyzed for possible SUDEP. Lettering within (A–E) correlate subjects with the seizure example panels in Fig. 4. (C) Cumulative time of recordings in grey and uncensored survival curves for each strain combination. Total recording time represented is 2751 days. (D) Cumulative number of seizures for each strain combination, with seizure origins indicated as hippocampal, cortical, and unknown. The cumulative number of seizures (>10 s long) marked is 786, with none observed from control animals. (E) Total number of seizures by category for each animal. Multiple seizure types are frequently seen in individual animals in the postmalarial epilepsy cohorts, while no seizures were recorded in any of the control animal cohorts.

