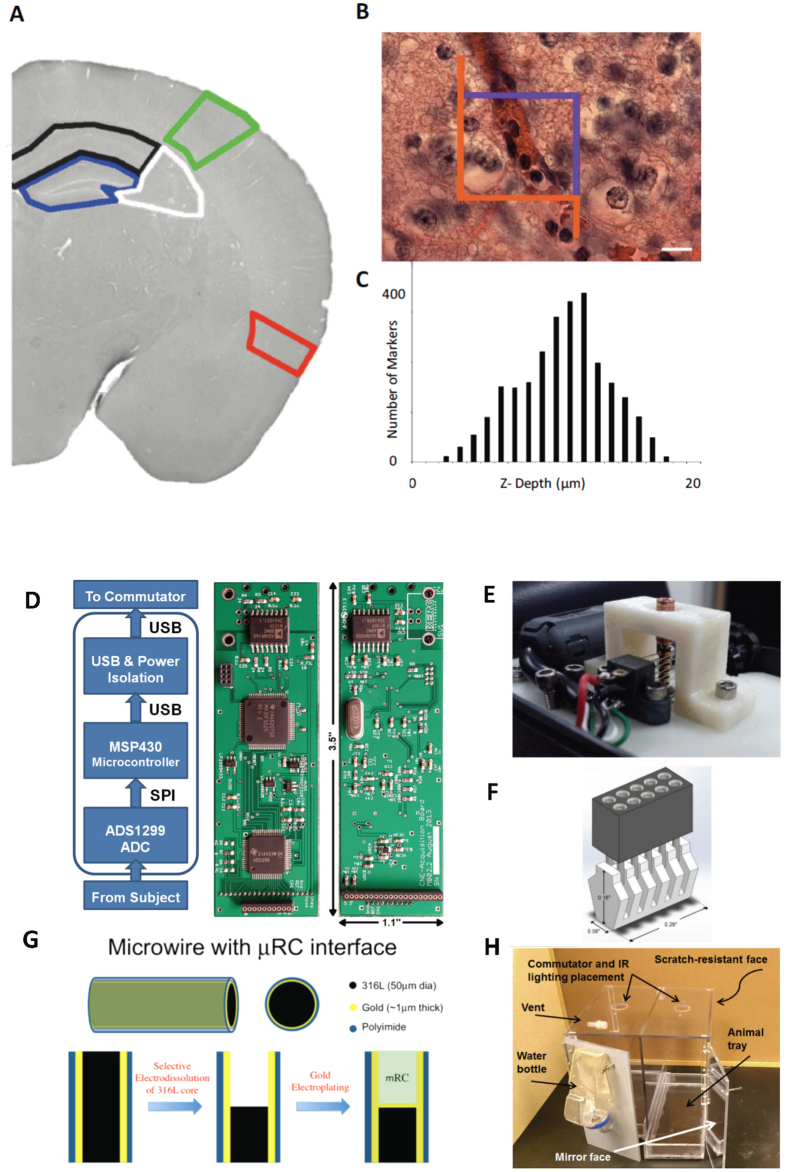
Figure 6. Methodology.
(A–C) Stereological Cell Counting Methods. (A) Brain regions of interest analyzed including the hippocampal sub-regions of the dentate gyrus (DG) outlined in blue, the CA3 outlined in white, and the CA1 outlined in black; somatosensory cortex outlined in green; and entorhinal cortex outlined in red. In B is shown a hematoxylin and eosin stained specimen with a superimposed optical fractionator counting frame (45 μm × 45 μm). Cells touching the purple boundary or inside the box are counted, but not if they touch an orange line. In C is shown a representative histogram demonstrating the number of cells counted along each plane of a single microscope slide. The top of the slide represents the first plane to come into focus. Note that a 2 μm guard zone was placed at the top and bottom of the 18 μm optical dissector depth. Scale bar for image A is 1000 μm and for image B is 15 μm. (D–H) Recording System Components. (D) Functional Schematic and photographs of custom 8-channel recording amplifier that includes a 24-bit digitizing analog front end, a microcontroller and power conditioning middle, and electrical isolation for power and USB. (E) Custom low-torque 4-circuit commutator that allows the recording amplifier to hang below it and permit free rotational motion of the cabled animal. (F) Custom headmount connector. (G) Micro-reaction chamber (μRC) electrodes created from hollowed out 50 μm gold coated stainless steel (type) wires internally deposited with iridium oxide to create very low electrical impedance electrodes. These μRC electrodes have reduced recording noise, and maintain quality recordings over the long periods of time required to perform these chronic experiments. (H) Custom designed animal housing cages that permit long-term video and electronic recordings from implanted animals.

