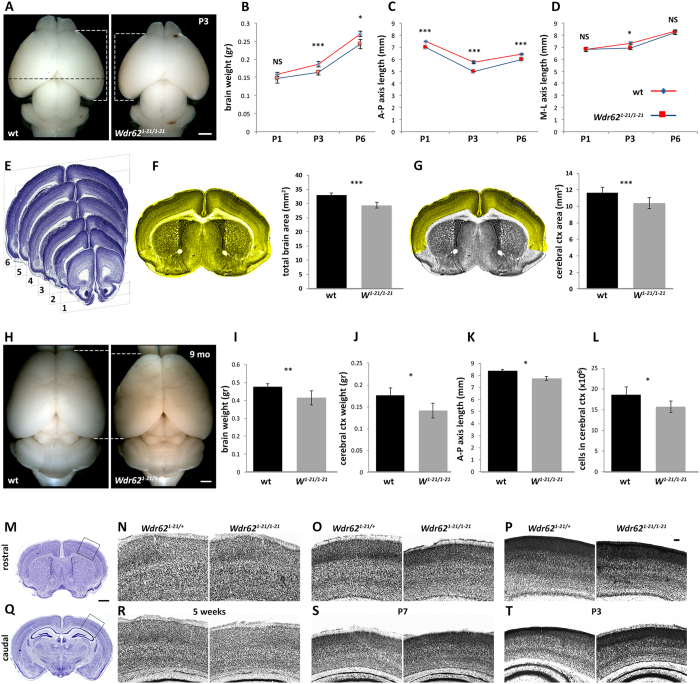
Figure 1. Microcephaly and abnormal brain cytoarchitecture in Wdr621-21/1-21 mice.
(A–L) Wdr621-21/1-21mice exhibit microcephaly. (A) Representative images of whole brains from WT and Wdr621-21/1-21 littermates at P3. (B) Brain weight is significantly decreased in Wdr621-21/1-21 pups compared with WT at P3 and P6. (C,D) Measurements of the anterior to posterior (A–P) white dotted brackets in (A) and medial to lateral (M-L, black dotted line in (A) axis length of WT and Wdr621-21/1-21 forebrains at P1, P3 and P6 show significant differences in (A–P) axis length (C) and a transient decrease in (M-L axis length at P3 (D) in Wdr621-21/1-21 forebrains compared with WT. Measurements were obtained from at least 3 and up to 9 pairs of brains per stage. (E–G) Total brain and cerebral cortical area are reduced in Wdr621-21/1-21mice. (E) Measurements were performed at six coronal levels along the A-P axis as indicated (n = 6 pairs, 6 sections per brain analyzed). (F,G) Significantly smaller brain (highlighted in F) and cerebral cortical (highlighted in G) areas in Wdr621-21/1-21 animals compared with WT. (H) Representative images of whole brains from WT and Wdr621-21/1-21 littermates at 9 weeks of age. (I–K) Reduced weight of whole brain (I) and cerebral cortex (J) and reduced length of A-P (K), but not M-L (see Figure S1), axis in Wdr621-21/1-21 mice compared with WT. (L) Decrease in total cell number in cerebral cortex and hippocampus of Wdr621-21/1-21 mice compared with WT as determined by the isotropic fractionator method (n = 4 pairs). (M–T) Wdr621-21/1-21mice exhibit abnormal cytoarchitecture in the cerebral cortex. Analyses of Nissl stained coronal brain sections at rostral (M–P) and caudal (Q–T) A-P levels at 5 weeks (M,N,Q,R), P7 (O,S) and P3 (P,T) reveals reduced thickness and abnormalities in neocortical cytoarchitecture in Wdr621-21/1-21brains compared with control (as indicated). At early postnatal stages, upper cortical layers appear condensed and deep layers are disorganized. These defects are more pronounced rostrally. In panels N–P and R–T, sections are shown in a medial (to the left) to lateral (to the right) orientation. Error bars represent s.e.m; ★p < 0.05, ★★p < 0.01, ★★★p < 0.005; NS: not significant (two-tailed Student’s t-test) Scale bar: (A,H): 1 mm; (M,Q): 0.5 mm; (P; applies to N–P and R–T): 0.1 mm.

