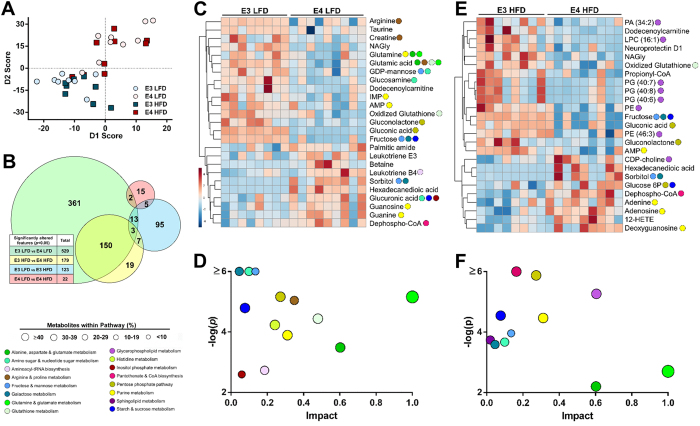
Figure 3. APOE genotype substantially alters the hippocampal metabolome.
(A) Principal component analysis (PCA) score plot of the hippocampus metabolome shows distinct separation based on apoE isoform. (n = 8–9). (B) The majority of altered features differ by apoE isoform. The Venn diagram depicts overlap between significantly altered MS/MS features (p < 0.05 FDR adjusted). The box shows the total number of altered features for each comparison. (n = 8–9). (C–F) Multiple metabolic pathways are significantly altered in an apoE isoform-dependent fashion. Hierarchical clustering of the top 25 most significantly altered metabolites between E3 LFD and E4 LFD mice (C), or between E3 HFD and E4 HFD mice (E). Color in the heat map reflects the relative metabolite abundance level, with red being higher, and blue lower, than the mean value. Colored circles denote the metabolic pathway(s) in which each metabolite plays a role. A global view of the metabolome was created using a pathway impact analysis (D,F), which reflects key nodes in pathways that have been significantly altered in an apoE isoform-dependent fashion in LFD (D) or HFD (F) fed mice. The y-axis shows significance based on pathway enrichment, the x-axis shows impact based on a topology measure of centrality and connectedness, and circle size reflects the percentage of all metabolites within a given pathway that are represented. (n = 8–9). Abbreviations: 12-HETE, 12-Hydroxyeicosatetraenoic acid; AMP, Adenosine monophosphate; CoA, Coenzyme A; FADH, Flavin adenine dinucleotide (semiquinone); G6P, Glucose 6-phosphate; GDP, Guanosine diphosphate; GSSG, Glutathione disulfide; IMP, Inosine monophosphate; LPC, Lysophosphatidylcholine; NAGly, N-Arachidonoyl glycine; PA, Phosphatidic acid; PE, Phosphatidylethanolamine; PG, Phosphatidylglycerol.

