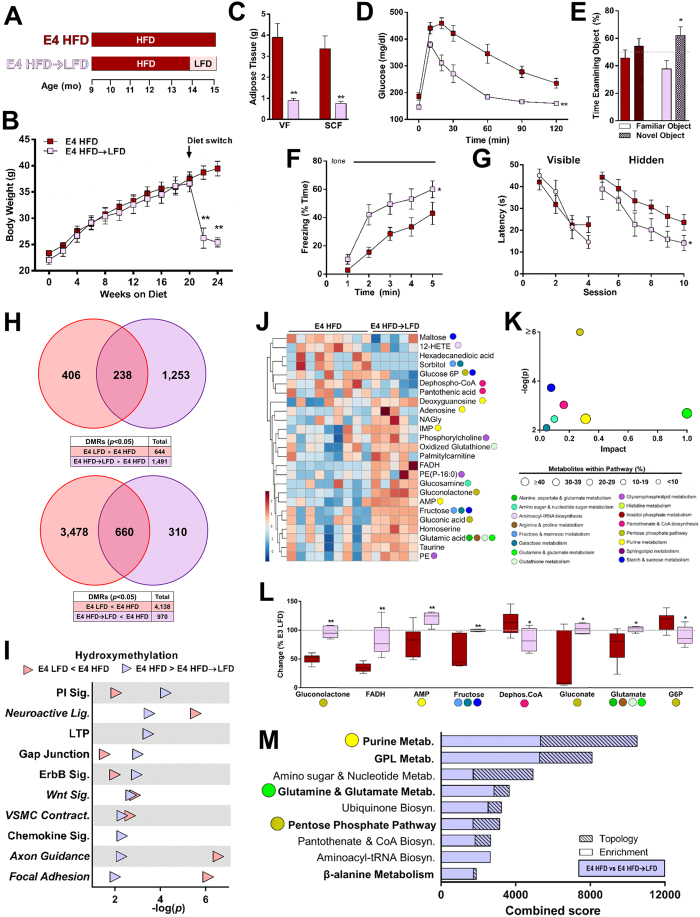
Figure 5. A dietary intervention rescues HFD-induced metabolic and cognitive impairments in E4 mice and reverses epigenetic and metabolic changes.
(A) A subset of E4 mice were fed HFD for 5 months, followed by LFD for one month (E4 HFD → LFD). (B-C) E4 HFD → LFD mice lose body weight and adipose tissue following the switch to a LFD. Body mass (B), and visceral fat (VF) and subcutaneous fat (SCF) pads (C) were weighed. (n = 9–19). (D) Glucose tolerance improves following the dietary intervention. Mice were administered an oral gavage of glucose following a 4 hour fast. (n = 9–13). (E) Object recognition is rescued in E4 HFD → LFD mice. (n = 7–12). (F) Cued fear memory is rescued in E4 HFD → LFD mice. (n = 7–12). (G) Spatial learning and memory in the water maze is rescued in E4 HFD → LFD mice. (n = 7–12). (H) Multiple DHRs are similarly altered in E4 LFD and E4 HFD → LFD, compared to E4 HFD mice. The boxes show total number of DHRs for each comparison (p < 0.05). (n = 4 pools; 2 pools/experimental group, consisting of 5 individual DNA samples/pool). (I) The majority of pathways differentially hydroxymethylated in E4 LFD mice are similarly altered in E4 HFD → LFD mice. (n = 4 pools; 2 pools/experimental group, consisting of 5 individual DNA samples/pool). (J-K) The E4 HFD metabolome is significantly altered by a dietary intervention. Hierarchical clustering of the top 25 most significantly altered metabolites between E4 HFD and E4 HFD → LFD mice (J). Pathway impact analysis (K). (n = 5–9). (L) Multiple metabolites are significantly altered following the dietary intervention (p < 0.05, t-test). Box and whisker plots reflect metabolite concentrations relative to E3 LFD. (n = 5–9). (M) An integrated pathway analysis shows that the dietary intervention affects, among others, the three pathways highlighted in Figure 5 (purine metabolism, glutamate metabolism, and PPP). *p < 0.05, **p < 0.01 compared to E4 HFD (C,E, ANOVA followed by Tukey’s multiple comparison test; B,D,F,G, repeated measures ANOVA). For E, *p < 0.05, compared to Familiar Object (ANOVA followed by Tukey’s multiple comparison test). T, target; R, right; L, left; O, opposite. Error bars represent mean ± SEM. E4 HFD data is reproduced from Figures 1, 2, 3, 4, 5.

