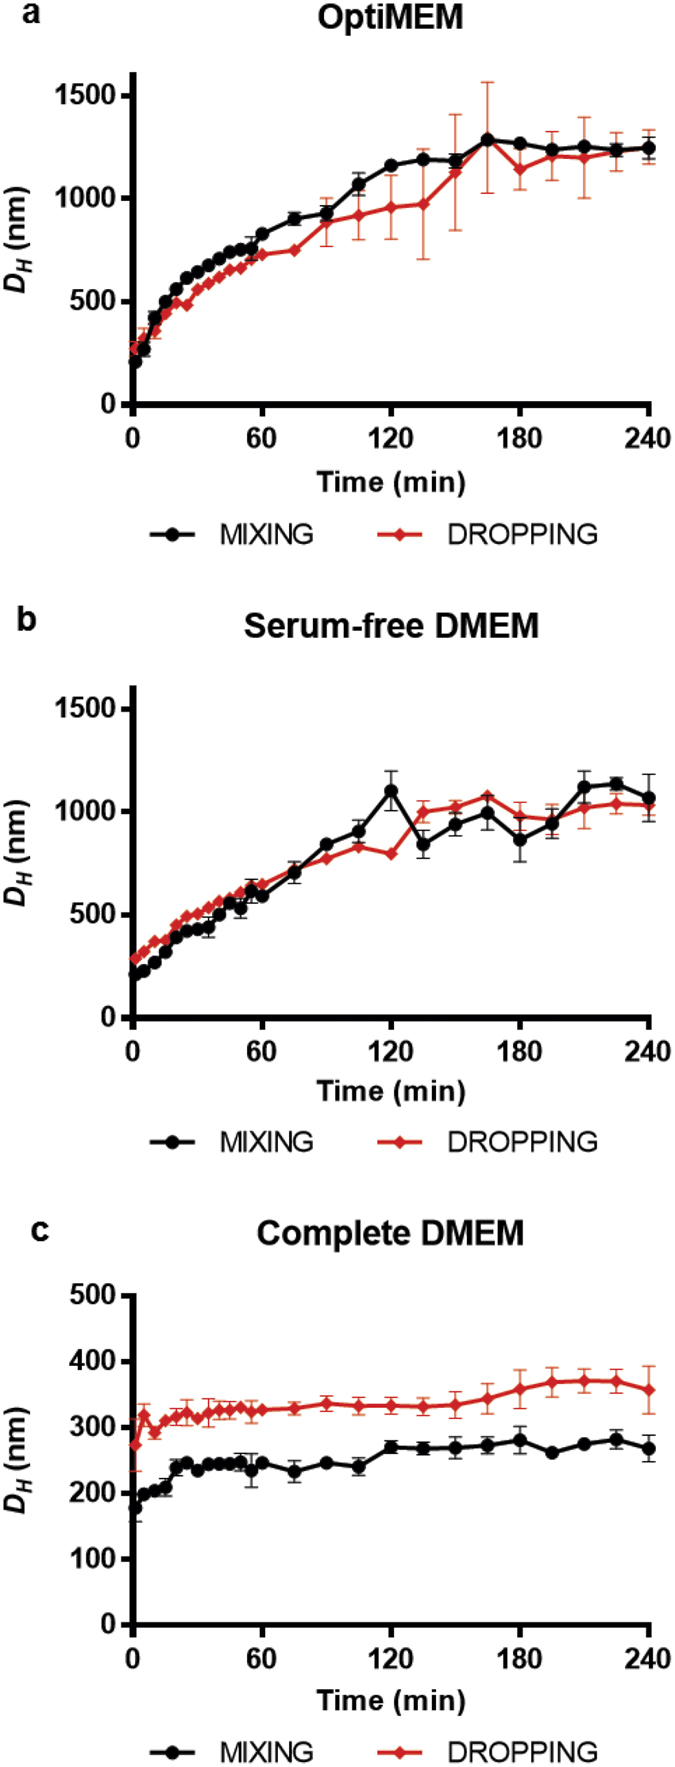
Figure 1. Typical temporal evolution of the DH of bPEI/pDNA complexes.

Polyplexes were prepared in 10 mM HEPES according to the MIXING and DROPPING modes, and diluted in (a) OptiMEM, (b) serum-free DMEM and (c) complete DMEM. DH of polyplexes was measured by DLS, using the size distribution analysis (CONTIN algorithm) to identify the position of the main peak.
