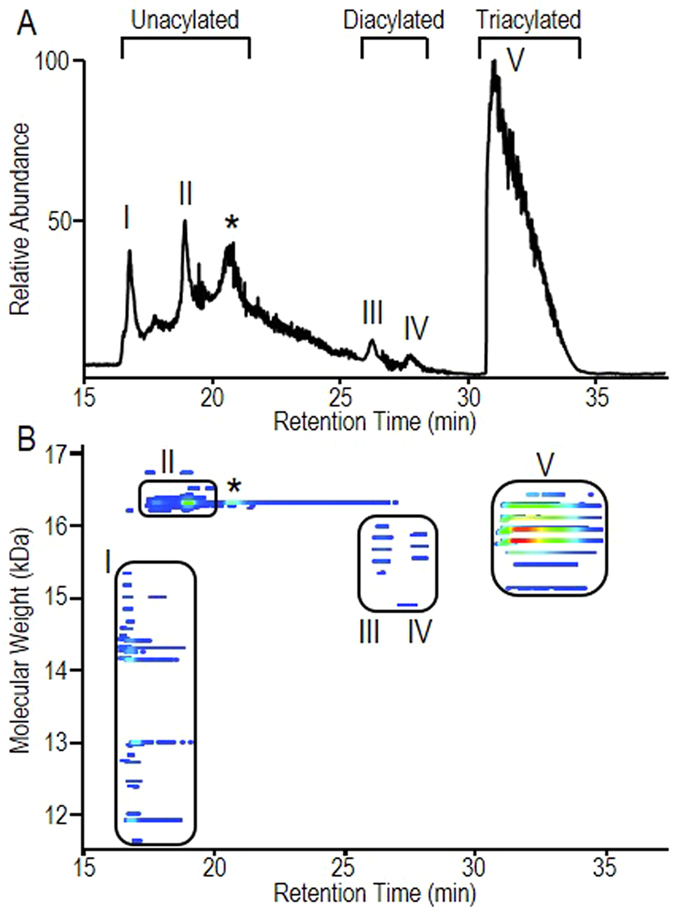
Figure 1. Protein footprint of rLpqHHis.

(A) LC-MS separation of the different acylated forms of the Mtb rLpqHHis expressed in M. smegmatis. The peaks I, II, III/IV and V of the Total Ion Chromatogram correspond to the non-acylated, di-acylated and tri-acylated form of rLpqHHis, respectively. The corresponding full MS spectra are shown in Fig. S1. (B) Proteoform footprint of the LC-MS run generated with RoWinPro55, showing the deconvoluted MWs obtained along the gradient. The relative intensities are color-coded (from blue to red). The peak noted by a star corresponds to a co-purified protein of similar MW identified as the M. smegmatis his-rich Lumazine Synthase (A0R6M2) (MW 16325 Da).
