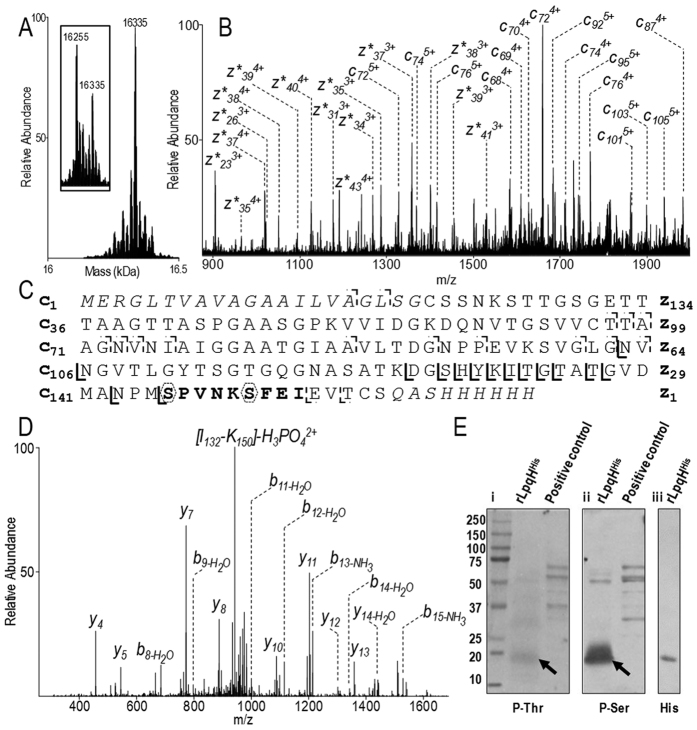
Figure 5. Evidence of phosphorylation of the LpqH preprolipoprotein.
(A) Deconvoluted mass spectra of chromatographic peak II, showing a full-length phosphorylated rLpqHHis proteoform (16335 Da). The inset shows the loss of the phosphate group (mass shift of −80 Da) after treatment with alkaline phosphatase. (B) Top-down ETD fragmentation localizes the phosphorylation site on the C-terminal side of the protein. Phosphorylated z fragments are marked with a star. (C) rLpqHHis sequence showing the z and c fragments generated by ETD: the phosphorylated fragments ions are indicated by bold lines while dashed line noted fragmentation sites correspond to non-modified ions. Dashed polygons indicate potential phosphosites. (D) Bottom-up CID fragmentation of peptide [I132-K150] evidencing the neutral loss of 98 Da corresponding to the dissociation of a phosphoric acid. (E) rLpqHHis (arrows) western blot detection with i) anti-phospho-threonine (clone 1E11), ii) anti-phospho-serine (clone 1C8) and iii) anti-His-Tag antibodies, supporting the presence of a phosphorylated Serine on rLpqHHis. Positive controls are phosphoproteins mixture provided by antibodies manufacturers.

