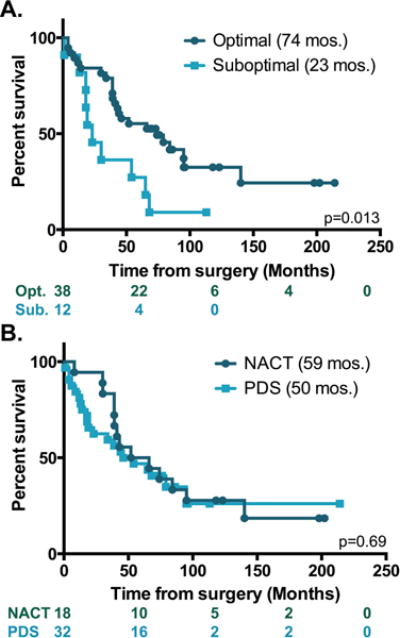
Figure 1. Survival analysis based on treatment.

Kaplan-Meier plots showing survival in months of patients with (dark teal) or without (light teal) optimal cytoreduction (A) or receiving neoadjuvant chemotherapy (NACT, dark teal) versus upfront surgery (light teal) (B). Log rank test was used to evaluate significance. The number of subjects at risk is indicated. p values shown on each graph.
