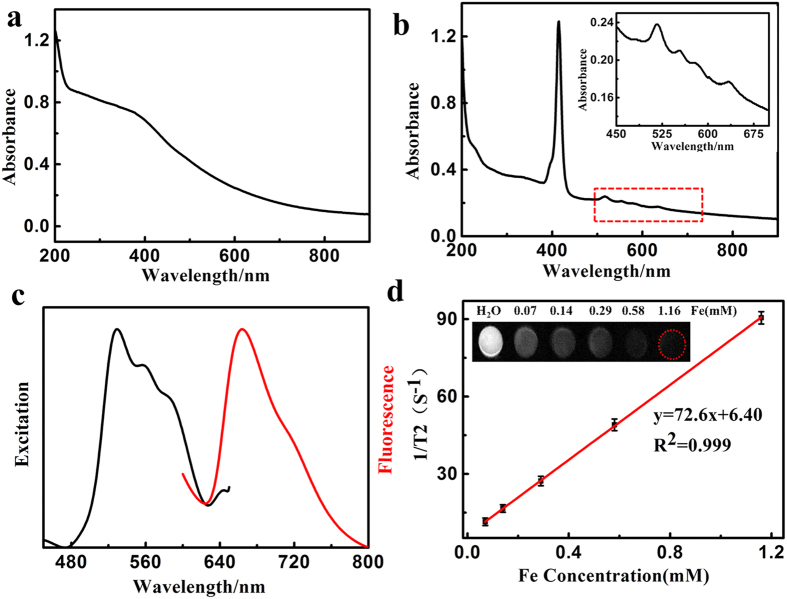
Figure 2. Optical properties and MR response of Fe3O4@C@PMOF.
UV−Vis spectra of (a) Fe3O4@C and (b) Fe3O4@C@PMOF nanocomposites. Inset: the amplification of the part spectrum. (c) The excitation and fluorescence spectra (excitation at 553 nm) of Fe3O4@C@PMOF aqueous solution. (d) T2-weighted MR images of Fe3O4@C@PMOF at different concentrations of Fe and the plot of 1/T2 over Fe concentration of Fe3O4@C@PMOF nanocomposites. The slope indicates the specific relaxivity (r2).

