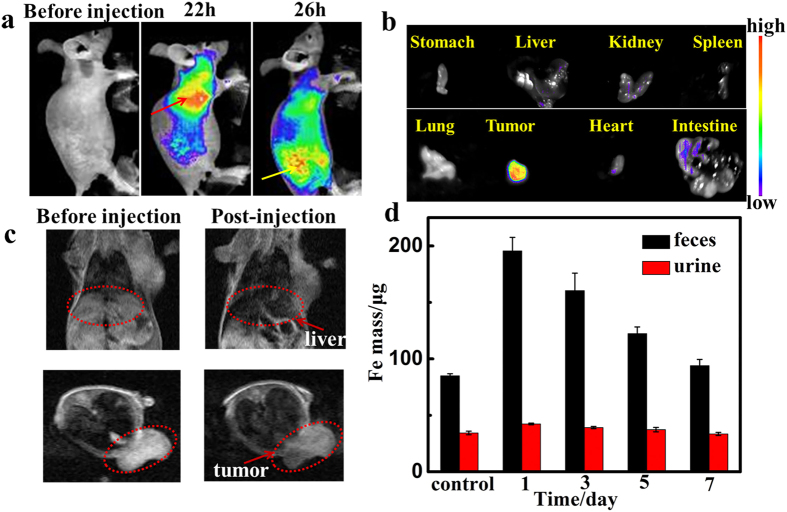
Figure 6. T2-weighted MR and fluorescent imaging of tumor-bearing mice and dissected organs.
(a) Fluorescent imaging (Ex = 550 nm, Em=660 nm) of tumor-bearing mice before and after intravenous injection of Fe3O4@C@PMOF (20 mg kg−1). The liver region was marked by red dot line and the yellow lines referred to tumor region. (b) Fluorescent imaging of dissected organs of tumor-bearing mouse.(c) T2-weighted MR imaging of tumor-bearing mice in the coronal plane (upper) and in the axial plane (lower). The liver region and tumor region were marked by red dot line. (d) The detected Fe mass in feces and urine at different time points after intravenous injection of Fe3O4@C@PMOF (20 mg kg−1).

