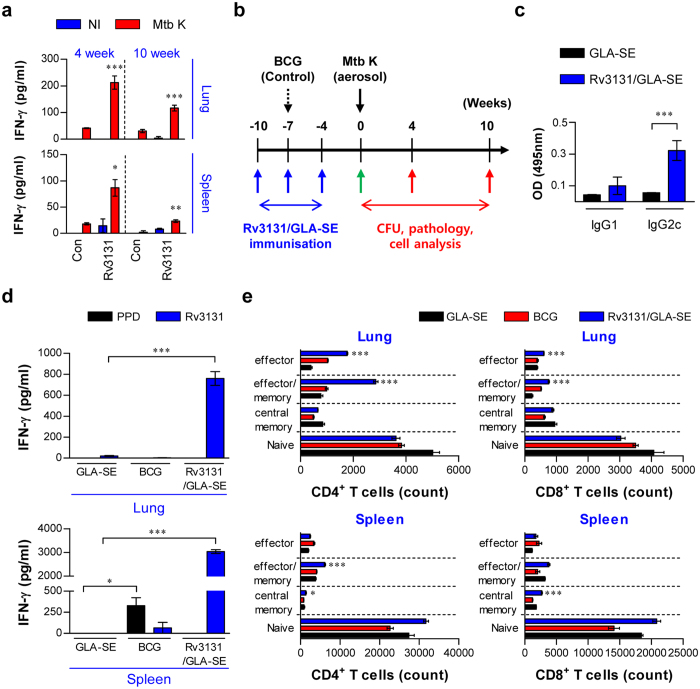
Figure 2. Ex vivo stimulation with Rv3131 elicits an Ag-specific IFN-γ response in both lung and spleen cells from Mycobacterium tuberculosis K-infected mice; immunisation with Rv3131 induces a Th1-type T cell response.
(a) The Rv3131-specific IFN-γ response was analysed after stimulating lung and spleen cells from each mouse with Rv3131 at 4 or 10 weeks after Mtb K infection via aerosolisation. The graphs illustrate the mean ± SD of 3 samples from each of 3 mice. One representative plot from three independent experiments is shown. *p < 0.05, **p < 0.01, and ***p < 0.001 compared to the non-stimulated infection group (Con). Rv3131: Rv3131-stimulated cells; NI: not infected. (b) Scheme of the experimental design for Rv3131 subunit vaccine testing. Mice (n = 17 per group) were immunised with Rv3131/GLA-SE or GLA-SE with only three intramuscular injections (blue arrows) before Mtb K aerosol challenge (black arrow). BCG was injected subcutaneously at the time of the 2nd Rv3131/GLA-SE injection (dashed arrow). Immunological analysis was performed before (green arrow; c–e) and after Mtb infection (red arrow). Bacterial counts and histopathological analysis in each group were determined at the indicated time points after Mtb infection (red arrow). (c) Serum antibody response at four weeks after the final immunisation with Rv3131/GLA-SE or adjuvant alone. The Rv3131-specific IgG1 and IgG2c responses in each group were measured in serum samples. (d) The level of IFN-γ secreted by lung and spleen cells from each fully immunised group in response to Rv3131 (5 μg/mL) or PPD (2 μg/mL) stimulation was detected by ELISA. *p < 0.05 and ***p < 0.001 compared to GLA-SE-immunised mice. (e) Analysis of T cell subpopulations after the final immunisation. The number of infiltrating CD4+, CD8+ effector (CD44hiCD62L−CD127−), effector/memory (CD44hiCD62L−CD127+), central memory (CD44hiCD62L+CD127+), and naïve (CD44loCD62L+CD127+) T cells in the lungs and spleens of each immunised group were analysed by flow cytometry. The data are presented as the mean ± SD from 5 mice in each group. The significance of the differences was determined using an unpaired t-test. *p < 0.05, **p < 0.01, and ***p < 0.001 compared to the GLA-SE-alone group.

