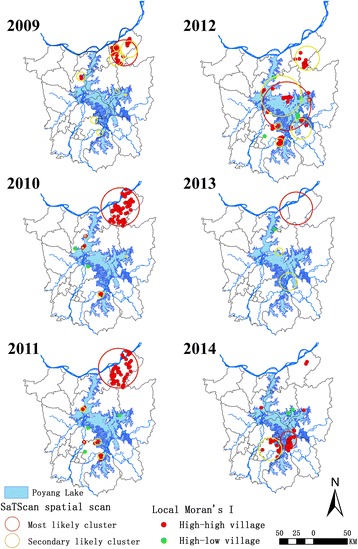
Fig. 2.

Annual number and distribution of spatial clusters of schistosomiasis cases identified in the period 2009–2014. Each panel shows the results of both methods: Local Moran’s I (Anselin) and SaTScan (Kulldorff). During 2009 to 2014, 167 high-risk counties were identified by Local Moran’s I with an annual number ranging from 1 (in 2013) to 63 (in 2010). The number of clusters defined by SaTScan decreased from 15 in 2009 to 3 in 2014 with an obvious tendency to transfer the focus to the South
