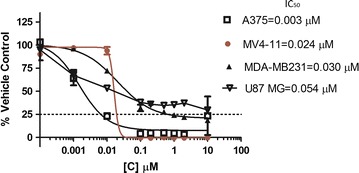
Fig. 2.

WST-1 assay results for HLBT-100 in 72 h against MV4-11, MDA-MB231. PC-3, A375 and U87 MG. Following treatment of cells, dose response curves were plotted and IC50 values calculated using graphpad prism software. The mean IC50s and standard deviations generated are as follows: MV4-11 = 0.024 ± 0.001 µM; MDA-MB231 = 0.030 ± 0.008 µM; PC-3 = 0.031 ± 0.011 µM; A375 = 0.004 ± 0.003 µM; U87 MG = 0.054 ± 0.006 µM
