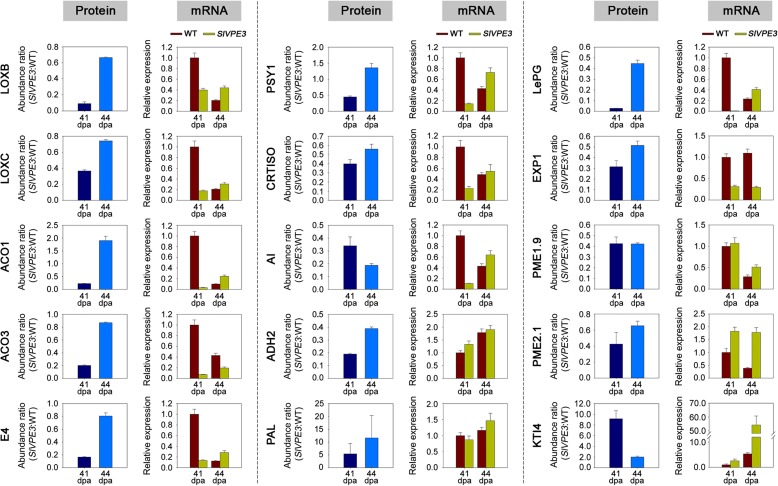
Fig. 6.
Comparison of expression profiles at the protein and mRNA levels. The protein abundance in wild-type (WT) and SlVPE3 RNAi fruit at 41 and 44 days post-anthesis (dpa) was assessed by isobaric tags for relative and absolute quantification (iTRAQ)-based quantitative proteome analysis. Transcript abundance was evaluated by quantitative RT-PCR. The gene transcript levels are normalized against the ACTIN gene, followed by normalization against the expression in WT. Values are shown as the means ± standard deviation

