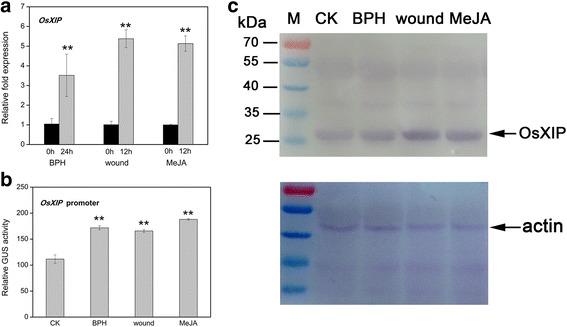
Fig. 1.

Inducible expression of OsXIP after different treatments. a Transcript levels of OsXIP in rice leaves after different treatments were analyzed by qRT-PCR. Two-weeks-old WT seedlings were treated with BPH for 24 h, wounding for 12 h and MeJA for 12 h, respectively. The data represent means ± SD of three independent replicates. Asterisks indicate statistically significant differences compared with CK (0 h) (**P < 0.01; Student’s t test). b GUS activity of OP1 transgenic rice after different treatments was measured by quantitative fluorescence method. Two-weeks-old transgenic rice seedlings were treated with BPH for 24 h, wounding for 12 h and MeJA for 12 h, respectively. The data represent means ± SD of three independent replicates. Asterisks indicate statistically significant differences compared with CK (**P < 0.01; Student’s t test). c Western blot analysis of OsXIP. Protein fractions were isolated from leaves of WT treated with BPH for 24 h, wounding for 12 h and MeJA for 12 h, respectively and subjected to immunoblot with anti-OsXIP antibody (top panel). M, markers of proteins, the sizes of the markers are indicated at the left of the picture. Fractions corresponding to 10 μg were loaded into each lane and equal loading was confirmed by anti-actin antibody (bottom panel)
