. 2016 Aug 25;8(1):515–523. doi: 10.1039/c6sc03070j

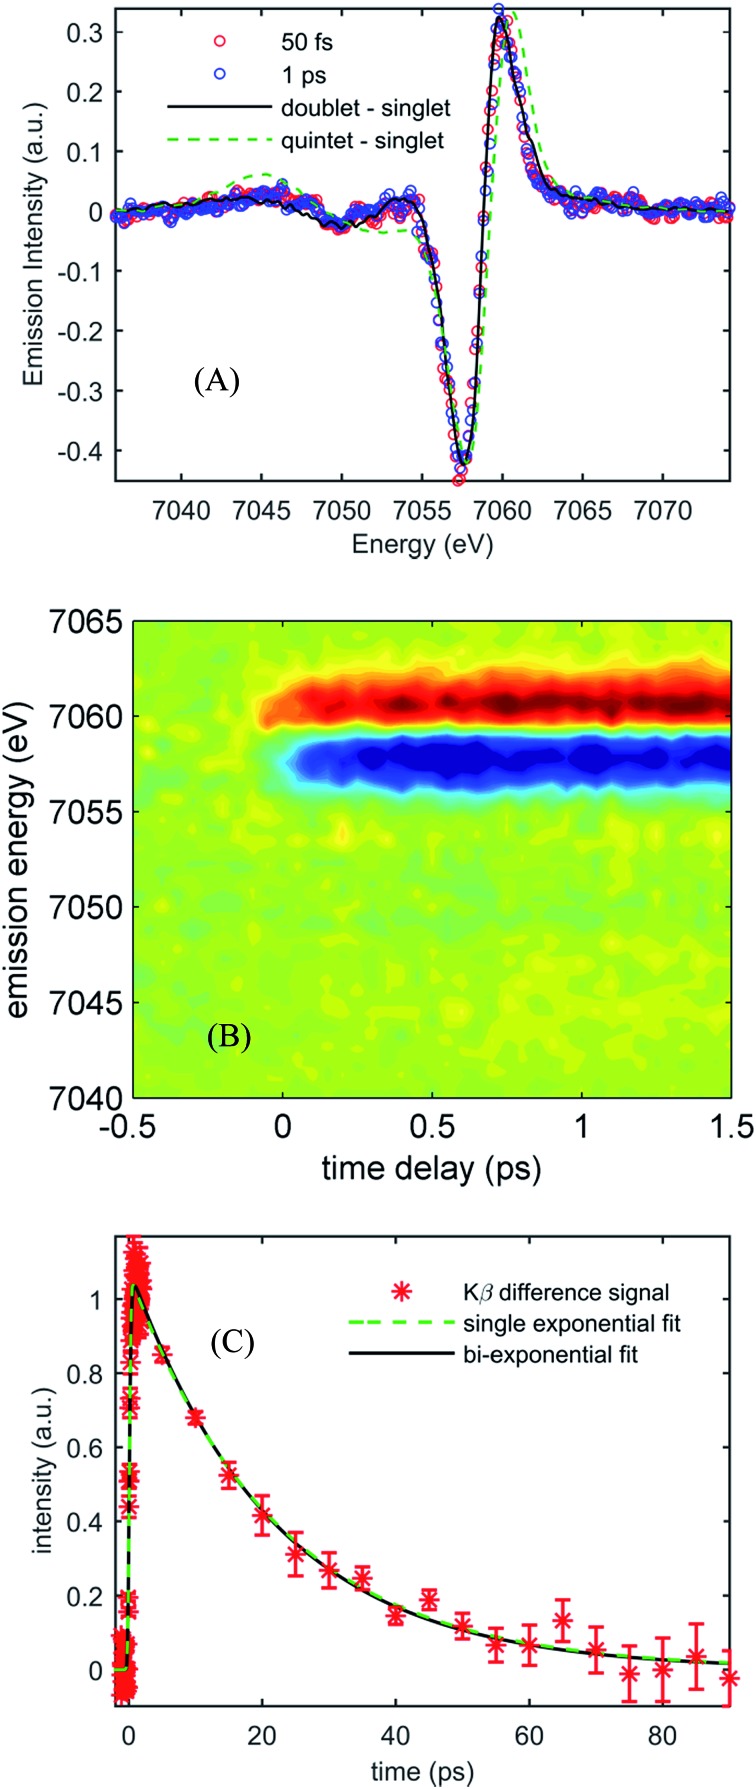
Fig. 3. (A) Kβ transient difference spectra for 50 mM [Fe(CN)4(bpy)]2– in dimethyl sulfoxide obtained at 50 fs time delay (red circles) and 1 ps time delay (blue circles), fitted by the 1,3MLCT reference spectrum (black curve) and the 5MC reference spectrum (dashed green curve). (B) Contour plot of time-dependent optically-induced changes in Kβ fluorescence difference spectra for 50 mM [Fe(CN)4(bpy)]2– in dimethyl sulfoxide for time delays up to 1.5 ps. (C) The integrated absolute value of the Kβ fluorescence difference spectra as a function of time delay for [Fe(CN)4(bpy)]2– in dimethyl sulfoxide, as well as single and bi-exponential fits to the data. The single exponential fit returns a 19 ± 2 ps lifetime.

Fig. 3