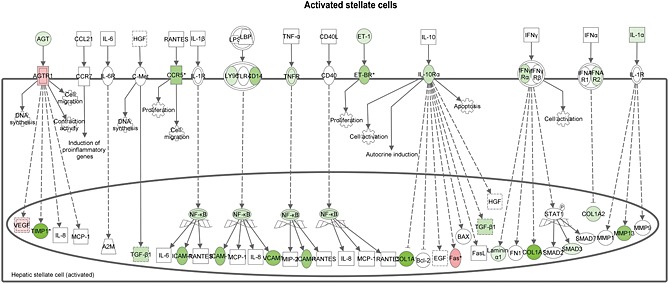
Figure 5.

Hepatic fibrosis pathway analysis. Pathway analysis showing statistically significant gene expression changes in activated hepatic stellate cells of APOE*3Leiden.CETP mice fed a HFC diet supplemented with salsalate for 12 weeks (n = 8) relative to HFC diet fed control group (n = 9). Red colour indicates up‐regulation, and green colour indicates down‐regulation.
