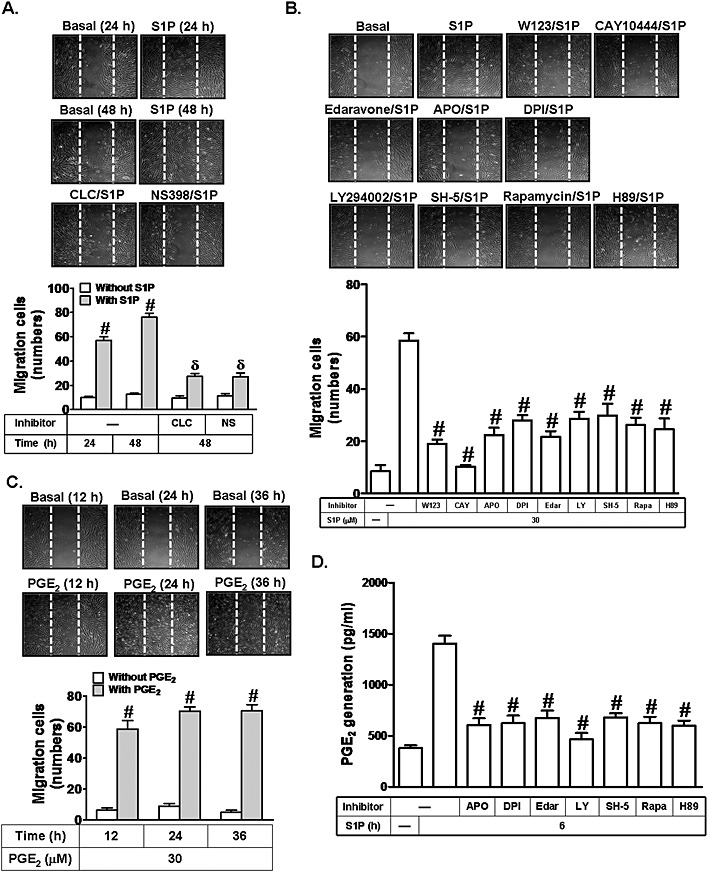
Figure 5.

S1P induces COX‐2/PGE2‐dependent cell migration. (A) HTSMCs were treated with S1P (30 μM) for the indicated time intervals or pretreated without or with CLC (10 μM) or NS398 (NS, 10 μM) for 1 h, and then incubated with S1P (30 μM) for 48 h. Representative images are shown in the upper panel, and quantification of the images is shown in the lower panel. (B) Cells were pretreated without or with W123, CAY10444 (CAY), LY294002 (LY), SH‐5, rapamycin (Rapa), H89, edaravone (Edar), apocynin (APO) or DPI, and then incubated with S1P (30 μM) for 48 h. (C) Cells were treated with PGE2 (30 μM) for the indicated time intervals. Images shown are representative of three independent experiments with similar results. (D) Cells were pretreated with LY294002 (LY), SH‐5, rapamycin (Rapa), H89, edaravone (Edar), apocynin or DPI, and then incubated with S1P for 6 h. The release of PGE2 was measured. Data are expressed as mean ± SEM of five independent experiments. # P < 0.01, as compared with the cells exposed to S1P alone (B and D) or vehicle (A and C). δ P < 0.01, as compared with the cells exposed to S1P for 48 h (A).
