
Figure 3.
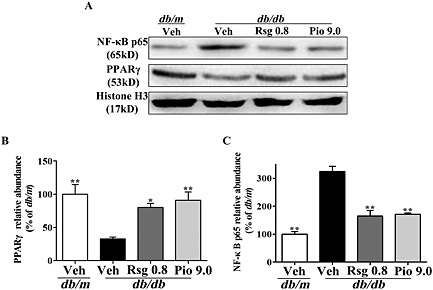
Effects of PPARγ agonists on PPARγ and NF‐κB p65 at the BBB in db/db mice. NF‐κB p65 or PPARγ (A) was detected by Western blot. Histone H3 was used as a loading control. Quantification of PPARγ (B) and NF‐κB p65 (C) are expressed as a percentage of the db/m. Values shown are expressed as mean ± SEM; n = 3. *P < 0.05, **P < 0.01 versus db/db + Veh group.