
Figure 1.
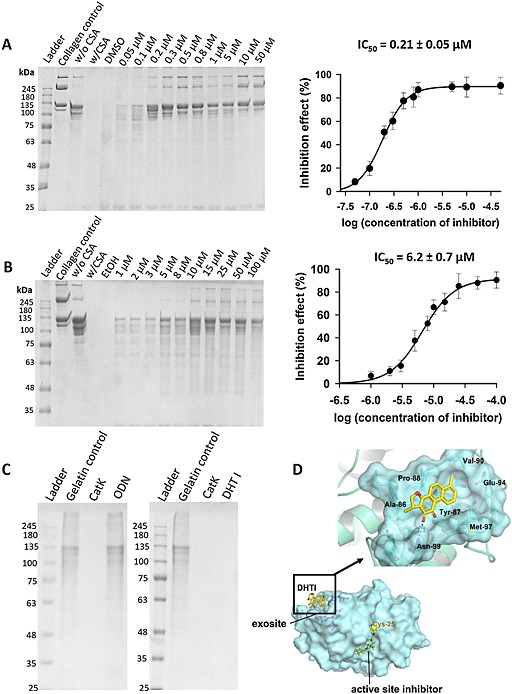
Inhibition of soluble collagen and gelatin degradation by DHT1 and ODN. SDS‐PAGE analyses and IC50 plots for type I collagen degradation with (A) active site inhibitor (ODN) and (B) exosite inhibitor (DHT1). CatK concentration was 400 nM, and digestion was performed at pH 5.5 and 28°C for 4 h. The IC50 of DHT1 was 6.2 ± 0.7 μM, and for ODN 0.21 ± 0.05 μM (n = 5). (C) SDS‐PAGE analysis of gelatin degradation with DHT1 and ODN. CatK concentration was 5 nM, and digestion was performed at pH 5.5 and 28°C for 1 h (n = 5). (D) Putative docking site of DHT1 on CatK: molecular structure of human CatK based on PDB ID, 4DMX indicates the binding site with DHT1 in the exosite region, shown in yellow. The binding site of DHT1 is remote from the active site of CatK, where an active site‐bound inhibitor is shown in green.