
Figure 4.
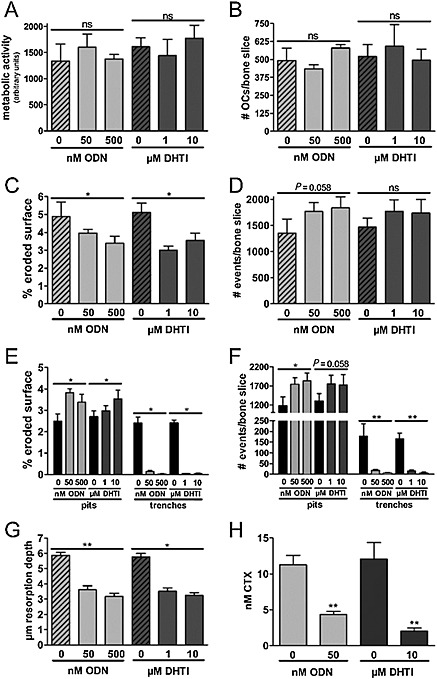
Effect of DHT1 and ODN on bone resorption parameters. The effect of DHT1 and ODN at different concentrations was observed on the basis of resorption cavities generated by human OCs, cultured on bovine bone slices for 72 h. (A–H) Represent data obtained from the same experiment. (A) Metabolic activity of OCs after treatment with DHT1 (three bone slices for each of three donors) and ODN (three bone slices for each of six donors) when compared with untreated OCs (three bone slices for each of six donors). (B) TRAP‐positive OCs with two nuclei or more were counted manually using light microscopy (three bone slices for each of three donors for each condition). The number of TRACP‐positive multinucleated OCs was unaffected by the use of either inhibitor. (C) Effect of DHT1 (five bone slices for each of six donors) and ODN (five bone slices for each of 10 donors) on the % eroded surface. (D) Effect of inhibitors on total number of resorption events (ODN: five bone slices for each of four donors. DHT1: five bone slices for each of four donors). (E) Effect of inhibitors on the % of eroded surface in terms of trenches and pits (ODN: five bone slices for each of 10 donors. DHT1: five bone slices for each of six donors). (F) Effect of inhibitors on the proportion of pits and trenches expressed in the number of resorption events per bone slice (ODN: five bone slices for each of four donors. DHT1: five bone slices for each of four donors). (G) Maximum depth measurements of resorption cavities formed by OCs showed a significant and similar reduction in maximum depth after treatment with DHT1 (five bone slices for each of three donors) and ODN (five bone slices for each of four donors). (H) Effect of both inhibitors on CTX concentration in conditioned media after 72 h in untreated, ODN (seven bone slices for each of three donors) and DHT1 (seven bone slices for each of two donors) treated cultures. Statistics (A–G) Kruskal–Wallis test; (H) Mann–Whitney test. ‘ns’, not significant; * P < 0.05; ** P < 0.01; *** P < 0.001.