
Figure 5.
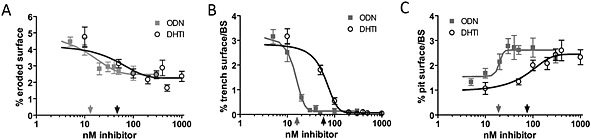
Effect of a dose titration with ODN and DHT1 on the extent of eroded surface, trench and pit formation. (A) Dose‐response curves for effects of ODN and DHT1 on eroded surface per bone surface. The data points were fitted to a one phase exponential decay curve (ODN: R 2 = 0.55; DHT1: R 2 = 0.43) and used to determine the respective IC50 concentrations of ODN: 15.3 ± 8.8 nM (indicated by light grey arrow above X‐axis) and DHT1: 51.5 ± 5.2 nM (indicated by dark grey arrow below X‐axis). (B) Effect of increasing doses of ODN and DHT1 on the extent of trench and (C) pit surface per bone surface. The data points were fitted to Boltzmann sigmoidal curves (trench response to ODN: R 2 = 0.92 and to DHT1: R 2 = 0.93; pit response to ODN: R 2 = 0.38 and to DHT1: R 2 = 0.54). These curves revealed an IC50 of 14.2 ± 4.4 nM for ODN (light grey arrow) and of 60.1 ± 0.4 nM for DHT1 (dark grey arrow) on trenches (B), and a half effect concentrations of 17.2 ± 3.2 nM for ODN (light grey arrow) and of 63.7 ± 18.7 nM for DHT1: (dark grey arrow) on pits (C). The graphs shown are from one representative experiment performed using five bone slices for each condition. The IC50 values were determined from three donors for ODN or from two for DHT1 tested in independent experiments (mean ± SD).