
Figure 7.
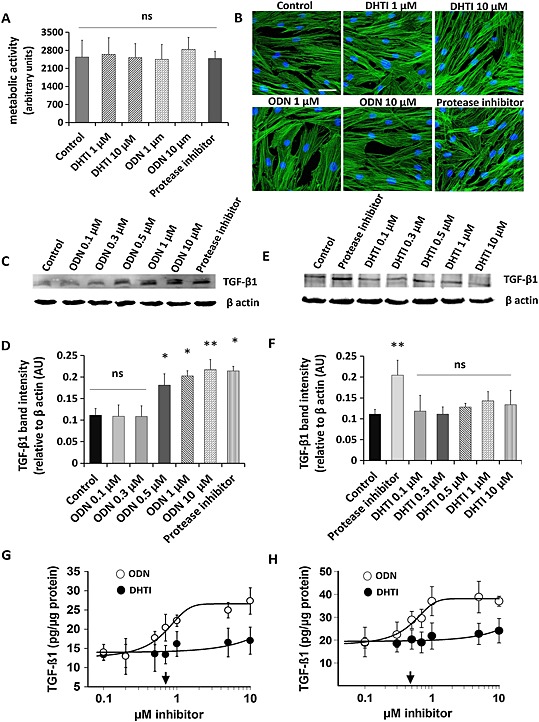
Comparative effect of DHT1 and ODN on TGF‐β1 accumulation in fibroblast cultures. (A) Effect of DHT1 and ODN inhibitors on the viability of fibroblasts. Cells were grown for 48 h under different conditions and cell viability was assayed using cell titer blue assay. (B) Control and inhibitors‐treated fibroblasts were stained with phalloidin and DAPI to observe any changes in morphology. (C–D) Western blot analysis and quantification for TGF‐β1 protein from the cell lysates isolated from fibroblasts treated with ODN and protease inhibitor cocktail at different concentration for 48 h. (E–F) Western blot analysis and quantification for TGF‐β1 protein from the cell lysates isolated from fibroblasts treated with DHT1 and protease inhibitor cocktail at different concentration for 48 h. Representative blots from four experiments are shown. Relative density of the TGF‐β1 bands normalized to β actin. TGF‐β1 quantification under control and inhibitors‐treated conditions in culture media (G) and cell lysate (H) was measured by ELISA. Total protein was corrected by total cell protein. The dose response curves revealed IC50 values of 0.711 ± 0.21 μM for ODN (arrow) in culture medium and of 0.487 ± 0.13 μM for ODN (arrow) in cell lysate. Both ELISA and Western blot analysis showed no dose response on inhibition of TGF‐β1 by DHT1 up to 10 μM, and no significant difference was observed when compared with the control (untreated condition). AU, arbitrary unit. Values are expressed as the average ± SD of four determinations. ‘ns’, not significant; * P < 0.05, ** P < 0.01, significantly different from untreated samples.