
Figure 5.
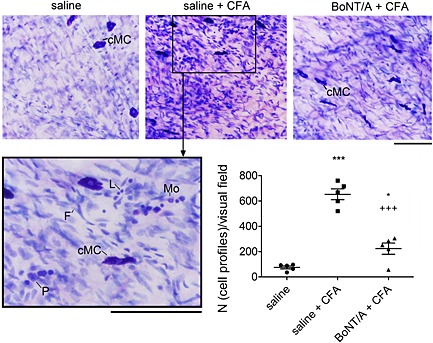
The effect of BoNT/A injection into the TMJ on inflammatory cell infiltration in dura mater in CFA‐treated rats. The 5 U kg−1 BoNT/A or saline were injected into the TMJ 3 days before the induction of TMJ inflammation by CFA. Histological staining of ipsilateral cranial dural tissue was performed using Giemsa staining. Number of Giemsa‐stained cell profiles was automatically quantified by CellSens Dimension visualizing programme (Olympus). Each data value represents mean of 4–5 visual fields per single animal. L, lymphocyte; Mo, monocyte; P, plasma cell, cMC, constitutive mast cell; F, fibrocyte. Scale bars = 100 μm. Scatter plot represents individual animal values, and horizontal lines and bars indicate mean ± SEM. n (animals per group) = 5. *P < 0.05, significantly different from saline control; ***P < 0.001, significantly different from saline control; +++ P < 0.001, significantly different from saline + CFA; one‐way ANOVA followed by Newman–Keuls post hoc test.