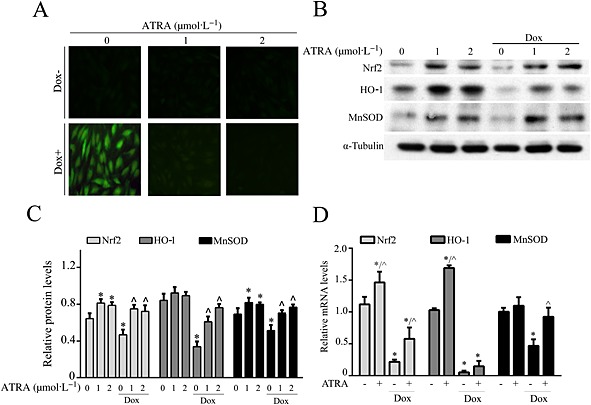
Figure 4.

ATRA reduces oxidative stress in doxorubicin‐treated H9c2 cells. (A) DCFH‐DA staining for the detection and evaluation of ROS. Representative images from each group (n = 6) are presented. (B) Western blot analysis of phase II detoxifying enzymes (n = 5). (C) Semi‐quantitative analysis for (Western blot analysis) of phase II detoxifying enzymes (Nrf2, HO1 and MnSOD). (D) PCR analysis of the mRNA levels of phase II detoxifying enzymes in doxorubicin‐treated cells. Quantitative values are computed as the ratios of the density of the targeted protein to that of α‐tubulin. Except as noted, the concentrations of ATRA (1 or 2 μmol·L−1) and doxorubicin 3 μmol·L−1 respectively. Data are expressed as the mean ± SEM. Data were analysed by anova. *P < 0.05 versus control and ^P < 0.05 versus Dox.
