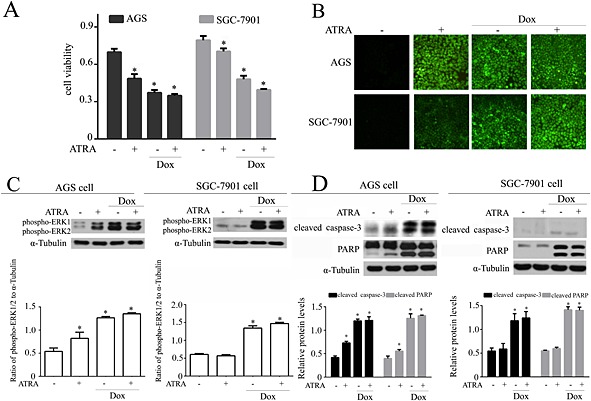
Figure 8.

Effects of ATRA on doxorubicin‐induced cell death in gastric cancer cells. (A) ATRA‐induced viability loss in gastric cancer cells (n = 5). (B) ATRA‐induced ROS generation in gastric cancer cells. Representative images from each group (n = 6) are presented. Western blot and semi‐quantitative analysis for (C) ERK1/2 activation and (D) apoptosis‐associated proteins. Quantitative values are computed as the ratios of the density of the targeted protein to α‐tubulin (n = 5). Except as noted, the concentrations of ATRA and Dox were 2 and 3 μmol·L−1 respectively. Data are expressed as the mean ± SEM and were analysed by anova. *P < 0.05 versus control.
