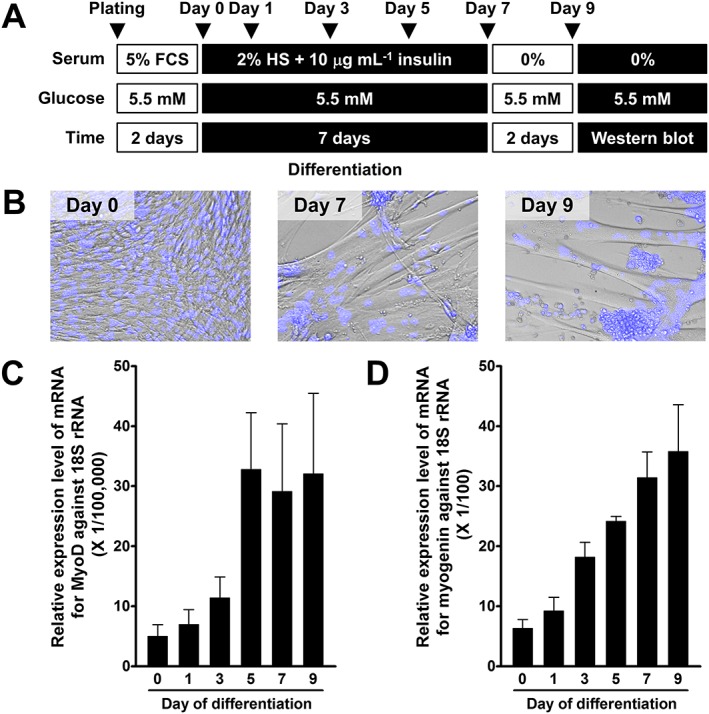
Figure 1.

Differentiation of L6 myoblasts into myotubes. (A) Protocol for differentiation of L6 myoblasts into myotubes. (B) Phase contrast images of undifferentiated myoblasts (Day 0) and differentiated myotubes (Days 7 and 9) obtained at the same magnification. The nucleus was stained with Hoechst 33342 dye as shown in blue. (C and D) Changes in mRNA levels of differentiation marker genes, MyoD (C) and myogenin (D), during differentiation. Ordinate represents relative expression levels against 18S rRNA as an internal control gene. Data are presented as means ± SEM of the results obtained from five experiments.
