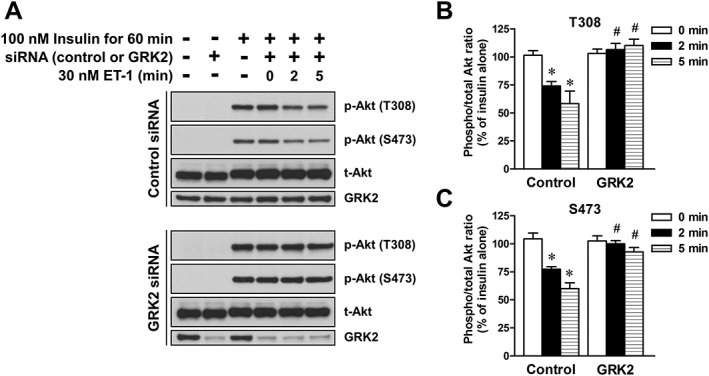
Figure 6.

Effects of introducing control and GRK2 siRNA on the ET‐1‐induced inhibition of insulin‐stimulated Akt phosphorylation in L6 myotubes. The cells were treated with 30 nM ET‐1 for indicated times during treatment with 100 nM insulin for 60 min. (A) Representative immunoblots obtained using antibodies to phospho‐Akt at Thr308 [p‐Akt (T308)], phospho‐Akt at Ser473 [p‐Akt (S473)], total Akt (t‐Akt) and GRK2. (B and C) ET‐1 induced changes in the ratio of phosphorylated Akt to t‐Akt. Ordinate represents Akt phosphorylation responses, which are normalized to the level of insulin‐stimulated Akt phosphorylation in L6 myotubes without treatment with ET‐1 and siRNA. Data are presented as means ± SEM of the results obtained from six experiments. * P < 0.05 versus its control (100 nM insulin alone). # P < 0.05 versus control siRNA‐treated cells.
