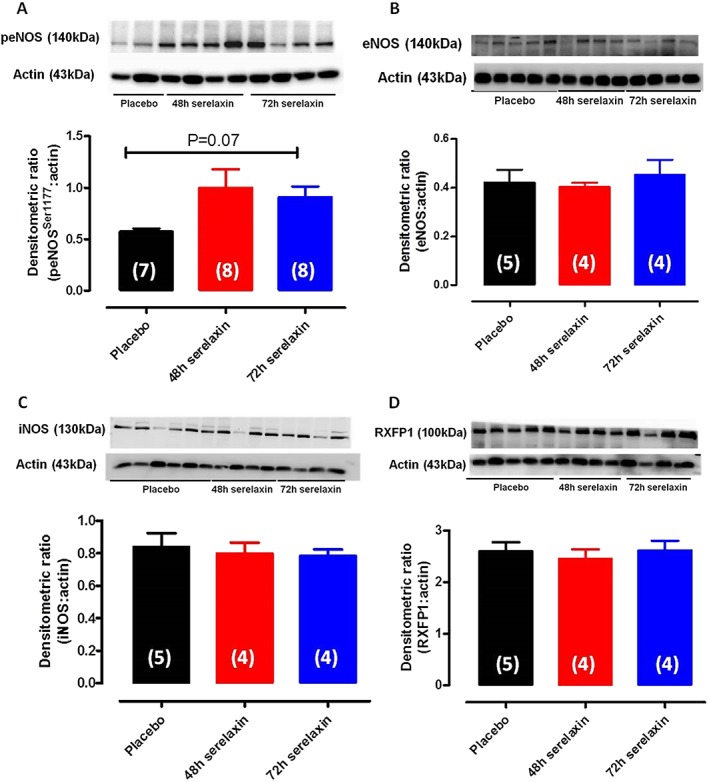
Figure 6.

Western blot analysis of phospho‐eNOSser1177 (A), total eNOS (B), iNOS (C) and RXFP1 (D) protein expression in aorta of rats treated with placebo, 48 or 72 h of continuous i.v. infusion of serelaxin. Representative blots are shown above their respective panels. n are shown in parentheses.
