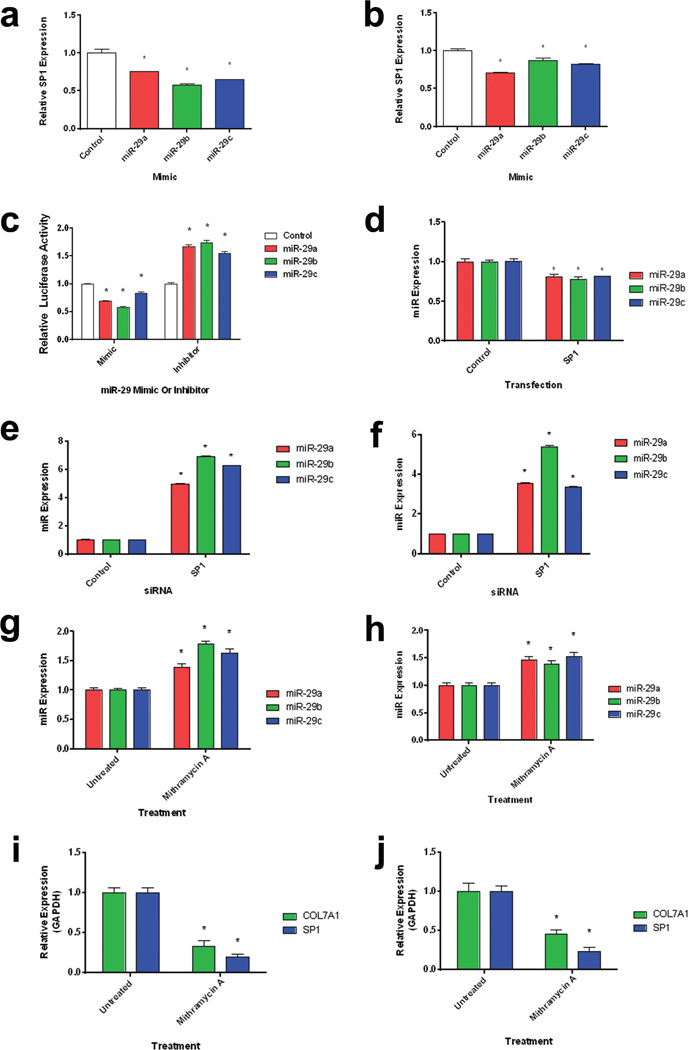
Figure 2. a–j: SP1 and miR-29 co-regulate each other and COL7A1.
Normal (a) and RDEB (b) dermal fibroblasts were transfected with miR-29 mimics. Quantitative RT-PCR analysis of SP1 expression relative to GAPDH expression 24 h after transfection. N = 3. Values represent mean ± SE. *P < 0.05. (c) 293T cells were transiently co-transfected with a luciferase reporter assay containing tandem repeats of the SP1 transcriptional response element in combination with either miR-29 mimics or inhibitors (Invitrogen). Luciferase levels were measured 24 h post-transfection. Firefly luciferase levels were normalized to renilla luciferase levels. N = 3. Values represent mean ± SE. *P < 0.05. (d) 293T cells were transfected with an SP1 overexpression vector for 24 h. Quantitative RT-PCR analysis of miR-29 levels relative to U6 levels. N = 3. Values represent mean ± SE. *P < 0.05. (e) Normal and (f) RDEB fibroblasts were transiently transfected with SP1 siRNA for 48 h. Quantitative RT-PCR analysis of miR-29 levels relative to U6 levels. N = 3. Values represent mean ± SE. *P < 0.05. Normal (g) and RDEB (h) fibroblasts were treated with mithramycin A (an inhibitor of SP1 binding) for 48 h. Quantitative RT-PCR analysis of miR-29 levels relative to U6 levels. N = 3. Values represent mean ± SE. *P < 0.05. Inhibition of SP1 binding decreases COL7A1 and SP1 Expression. Normal (i) and RDEB (j) fibroblasts were treated with mithramycin A (an inhibitor of SP1 binding) for 48 h. Quantitative RT-PCR analysis of COL7A1 and SP1 levels relative to GAPDH. N = 3. Values represent mean ± SE. *P < 0.05. RDEB, recessive dystrophic epidermolysis bullosa; RT-PCR, reverse transcriptase PCR; SE, standard error.

