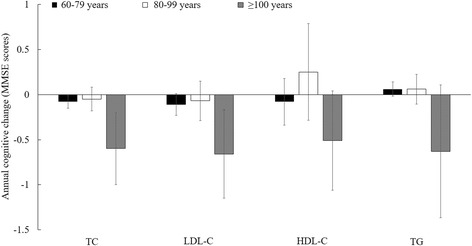
Fig. 1.

Mean difference in annual cognitive change for each mmol/L increment of lipid concentrations, stratified by age a. Abbreviation: TC = total cholesterol; LDL-C = low density lipoprotein cholesterol; HDL-C = high density lipoprotein cholesterol; TG = triglyceride. P interaction > 0.50 for all, suggesting that the association between lipids and cognitive decline was not modified by age. aAdjusted for age, sex, education (illiteracy, 1–6 years, or ≥6 years), smoking status (non-smoker and smoker (0.7–20.4, 20.5–44.4, or 44.5–220 pack-year)), alcohol intake (non-drinker and drinker (0.4–2.11, 2.12–4.67, or 4.68–67.7 servings/d)), physical activities (yes/no), depression symptoms (yes/no), BMI (<17.5, 17.5–23.0, 23.0–27.9, or ≥28.0 kg/m2), waist circumference (50–73, 74–80, 81–88, or 89–155 cm), hypertension (yes/no), plasma glucose (0.15–3.93, 3.94–4.68, 4.69–5.41, or 5.42–36.04 mmol/L), C-reactive protein (<1, 1–2.9, or ≥3 mg/L) and uric acid (women: <240, 240–360, or ≥360; men: <240, 240–420, or ≥420 μmol/L)
