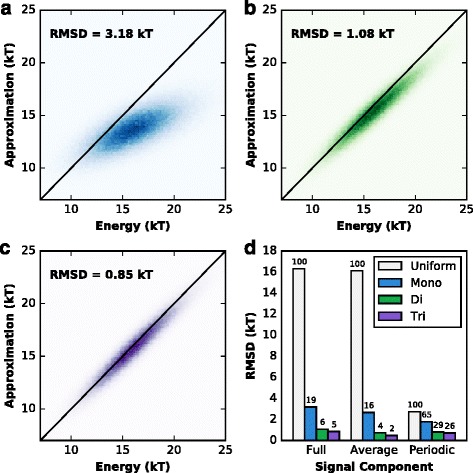
Fig. 1.

Accuracy analyses of the various models, benchmarked on the first chromosome of S. cerevisiae. a Histogram of the energy prediction pairs of the full model and mononucleotide approximative model for the same sequences. The black diagonal indicates perfect agreement. b, c As a for the dinucleotide and trinucleotide approximations, respectively. d Comparison of the root mean square deviations of the approximative predictions from those of the full model. The grey bars indicate the RMSDs of ‘bad’ models, defined for the Full and Average signals as a uniform landscape, and for the periodic signal as the real landscape shifted out of phase. The other values, for the mono-, di- and trinucleotide approximations are compared with these bad models. Indicated above each bar is a percentage indicating the value relative to the corresponding bad model
