
Figure 2.
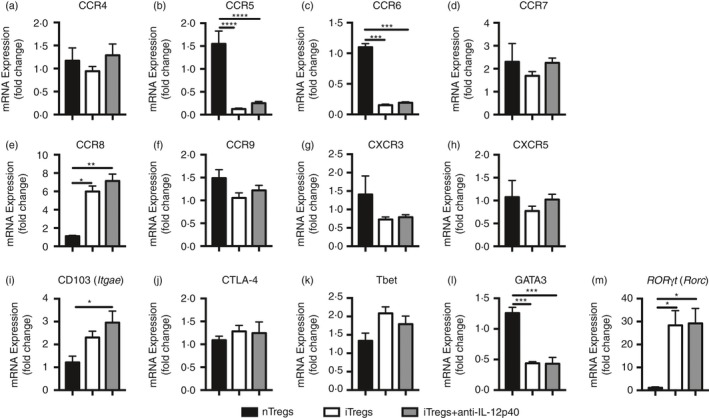
RT PCR expression of chemokine receptors, regulatory molecules and T‐cell nuclear transcription factors highlights some differences between natural regulatory T cells (nTregs) (from sorted GFP + cells from naive Foxp3‐GFP mice), induced regulatory T cells (iTregs) and iTregs+anti‐interleukin‐12p40 (IL‐12p40). mRNA was extracted from 1 × 10⁶ cells collected on different occasions (sorted nTregs, n = 4; cultured iTregs and iTregs+anti‐IL12p40, n = 6). Gene of interest has been compared to 18S expression and presented as relative expression to nTregs (control group). (a) CCR4, (b) CCR5, (c) CCR6, (d) CCR7, (e) CCR8, (f) CCR9, (g) CXCR3, (h) CXCR5, (i) CD103 (Itgae), (j) CTLA‐4, (k) Tbet, (l) GATA3 and (m) ROR γt (Rorc) between groups. *P < 0·05, **P < 0·01, ***P < 0·001, ****P < 0·0001.