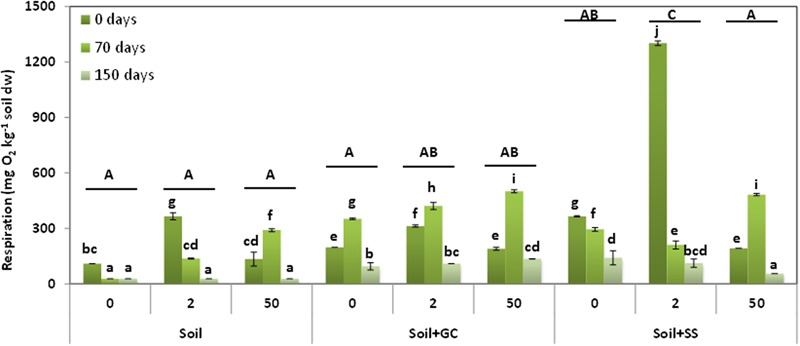
FIGURE 4.

Soil respiration in unamended and amended soils, untreated (control) and treated with triasulfuron at 2, 10, and 50 mg kg-1, at different incubation times. Bars represent the SD of the mean (n = 2). Different lower case letter above the bars denote significant differences (P < 0.05) between sampling times for herbicide doses and different upper case letter above the bars denote significant differences (P < 0.05) between herbicide doses (mean values) for each soil considering unamended and amended soils jointly.
