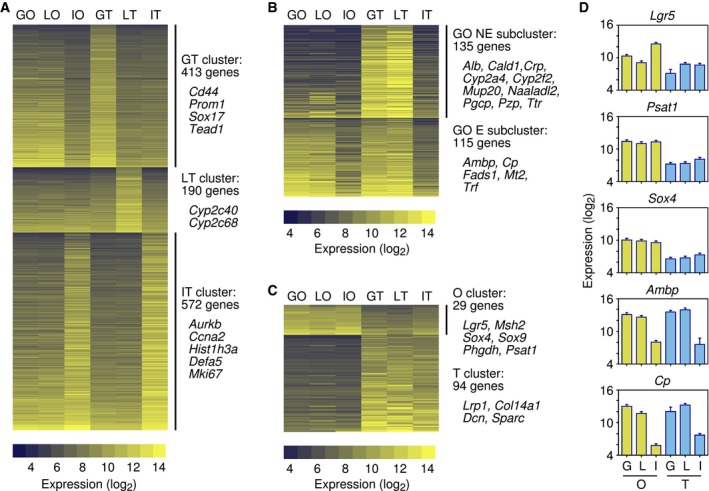
Figure 2. Gene expression profiles of gallbladder‐derived organoids.

- Clusters of gallbladder tissue (GT)‐specific, liver tissue (LT)‐specific, and small intestine tissue (IT)‐specific genes (Dataset EV2). The number of genes and the names of selected genes in each cluster are indicated. Gene expression levels (log2 scale) are shown for gallbladder organoids (GO), liver organoids (LO), intestinal organoids (IO) and gallbladder (GT), liver (LT), and intestinal (IT) tissues.
- Genes expressed in gallbladder and liver tissues, but not in the intestine, divided into two subclusters, depending on whether the genes were expressed or not in gallbladder organoids (Dataset EV3). The number of genes and the names of selected genes in each subcluster are indicated.
- Clusters of organoid (O)‐specific and tissue (T)‐specific genes (Dataset EV4). The number of genes and the names of selected genes in each cluster are indicated.
- Expression levels of selected genes from the clusters shown in (B) and (C). G, gallbladder; L, liver; I, intestine; O, organoid; T, tissue. Error bars are square root of MSE from ANOVA 2F (see Materials and Methods) (n = 2).
