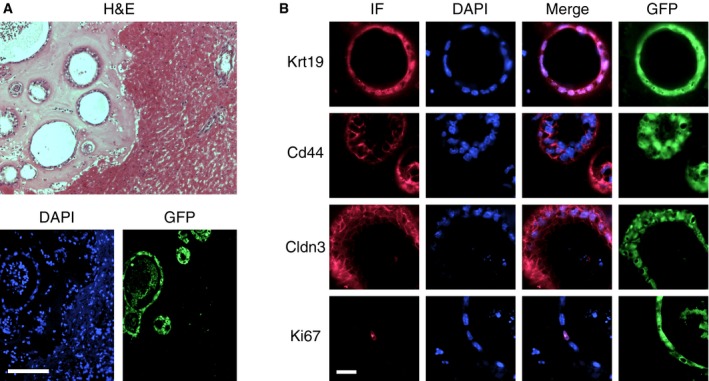
Figure 6. Engraftment of gallbladder organoids in the hepatic subcapsular space.

- (Top) Low‐magnification view showing organoids embedded in Matrigel® (left) next to the liver parenchyma (right) 2 weeks after engraftment. H&E, hematoxylin & eosin staining. (Bottom) Immunofluorescence staining for GFP expression to mark the engrafted organoids and DAPI counterstaining of the cell nuclei. The liver parenchyma corresponds to the right half of the images. Scale bar: 200 μm.
- Characterization of engrafted organoids by immunofluorescence (IF). Almost no organoid cell expressed Ki67 (the one positive cell shown in the image was an exception), in contrast to the high levels of cell proliferation and Ki67 expression observed in organoids cultured in vitro. Scale bar: 25 μm.
