
Figure EV3. Genes with an upstream LTR are not repressed in WT cells.
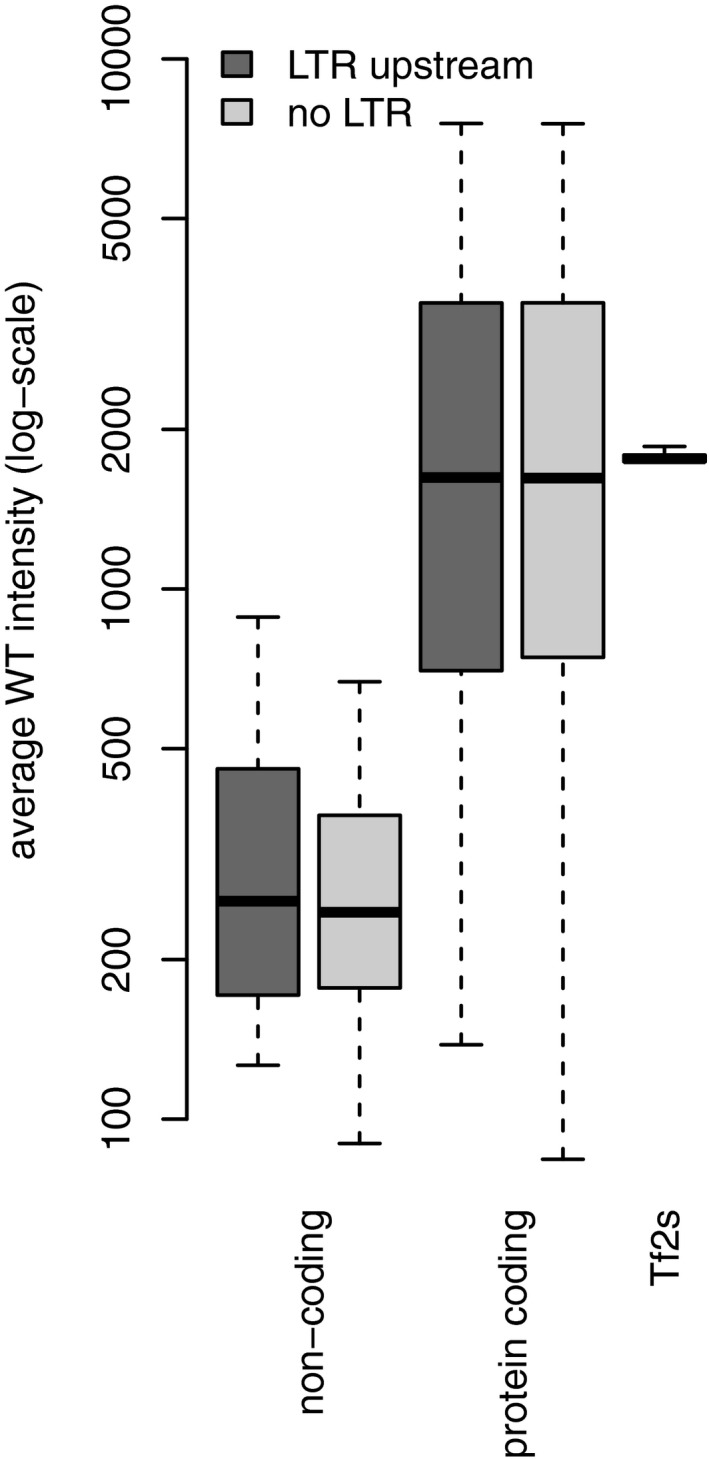
Transcripts with an upstream LTR are neither more nor less abundant than transcripts without an upstream LTR. Average signal intensity across genes of wild‐type RNA hybridized to tiling array shown as box plot for each of the following categories: noncoding with LTR (n = 69)/without LTR (n = 1,665); protein coding with LTR (n = 246)/without LTR (n = 4,887); Tf2s (n = 13).