
Figure 4. LTR‐proximal genes are upregulated in fft2Δ fft3Δ.
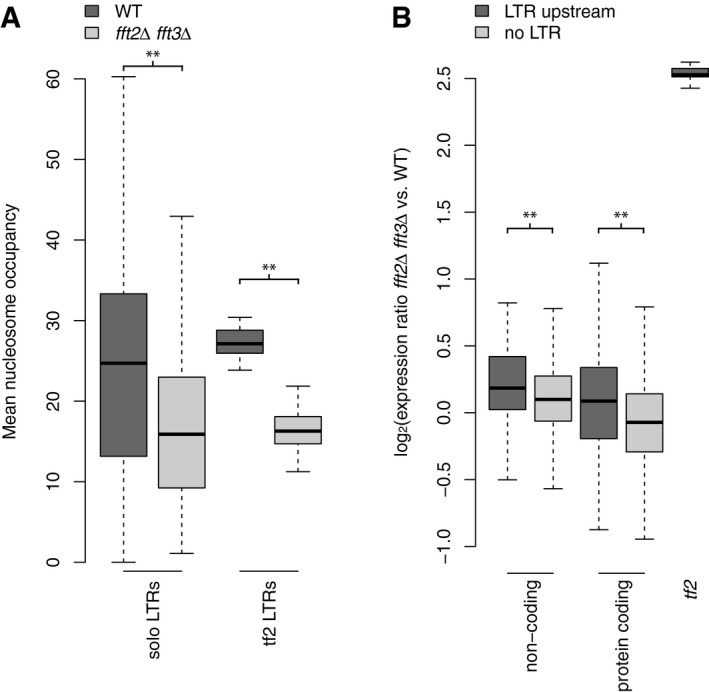
- Mean nucleosome occupancy over solo LTRs (n = 236) and tf2‐associated LTRs (n = 25), in WT and in fft2Δ fft3Δ.
- Mean ratio of expression (fft2Δ fft3Δ/WT) for each of the following categories: noncoding with LTR (n = 69)/without LTR (n = 1,665) (**P = 0.008); protein coding with LTR (n = 246)/without LTR (n = 4,887) (**P < 0.001); Tf2s (n = 13).
Data information: Data shown as box plots, significance of difference between categories was assessed by Wilcoxon–Mann–Whitney test (**P < 0.001).