
Figure 6. ATP‐dependent remodeling function is essential to retrotransposon regulation by Fft2 and Fft3.
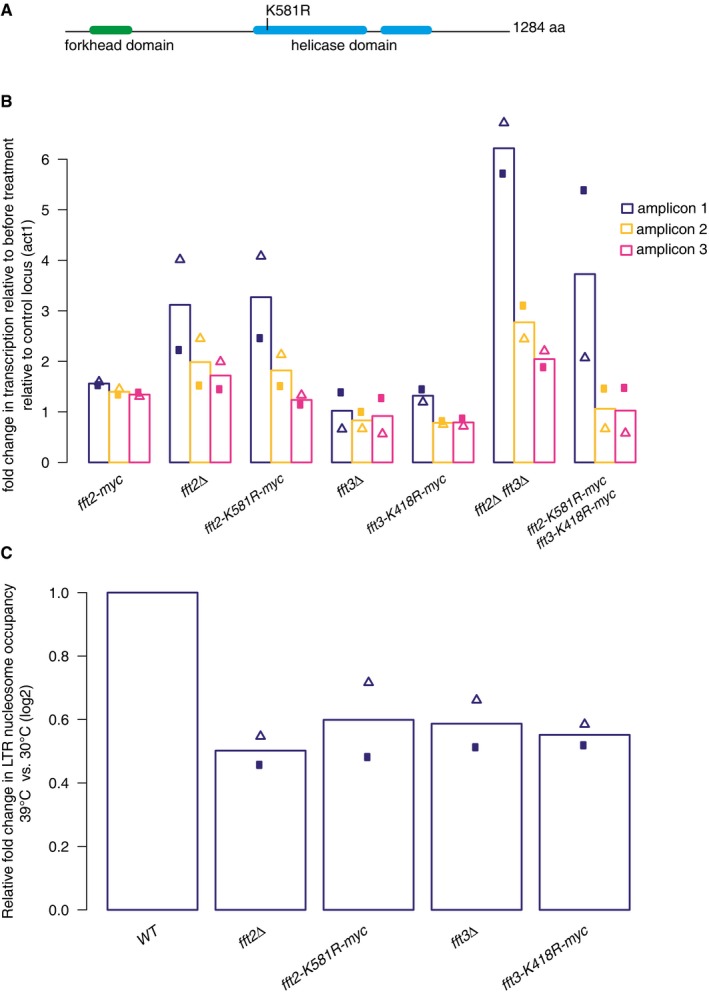
- Schematic of the Fft2 protein showing the location of the catalytic function‐abrogating point mutation K581R.
- Bar graph representing RNA levels as in Fig 1D, relative to a control locus (act1) and to WT levels, as measured by qPCR.
- TSS shift in Fft deletion and catalytic mutants is accompanied by reduced LTR nucleosome occupancy, measured by MNase‐qPCR as in Fig 5B.
Data information: Bars show mean of two biological replicates, with triangles and circles showing the values of the individual replicates.